CENTER FOR THE PROFESSIONAL EDUCATION OF TEACHERS
  • Home
  • Who We Are
    • Our Team
    • Our Partnerships
    • Our Authors
    • Principles of Practice
    • Job Opportunities
  • What We Do
    • Services
    • Equity in Action
    • Literacy Unbound Summer Institute
    • Signature Initiatives >
      • Literacy Unbound
      • New Teacher Network
      • Student Press Initiative
  • Educator Essentials
    • Book of the month
    • Online Courses
    • Professional Articles
    • Ready-to-use Resources
    • Teaching Today Podcast
  • Support CPET

4/21/2023

All of the Above: 3 Steps to Analyzing Multiple Choice Data

Comments

How to recognize patterns in student performance as you take your next steps toward strategic instruction. 
Picture
Picture
DR. ROBERTA LENGER KANG
Center Director​, CPET
​
Analyzing data from high-stakes exams is:
  • A. An important task for understanding student performance
  • B. Valuable to gain insights into patterns and trends for future performance
  • C. An overwhelming and confusing experience
  • D. All of the above

Answer: D — All of the above

While promising practices for using data to inform instruction are well intentioned, the process and impact often misses the mark. It can become an overwhelming and confusing experience that can pull educators into sinkholes that produce unreliable conclusions and eat up valuable time and resources. How can we yield the benefits of data analysis and avoid these drawbacks? 

Analyzing data is valuable because it helps us zoom out from individual results to recognize the patterns and trends in performance, so that we can make choices in the future that will benefit our students. But depending on the type of data we’re analyzing, and the purpose, how we approach the analysis and the conclusions we draw can change dramatically.

Where did the data come from?

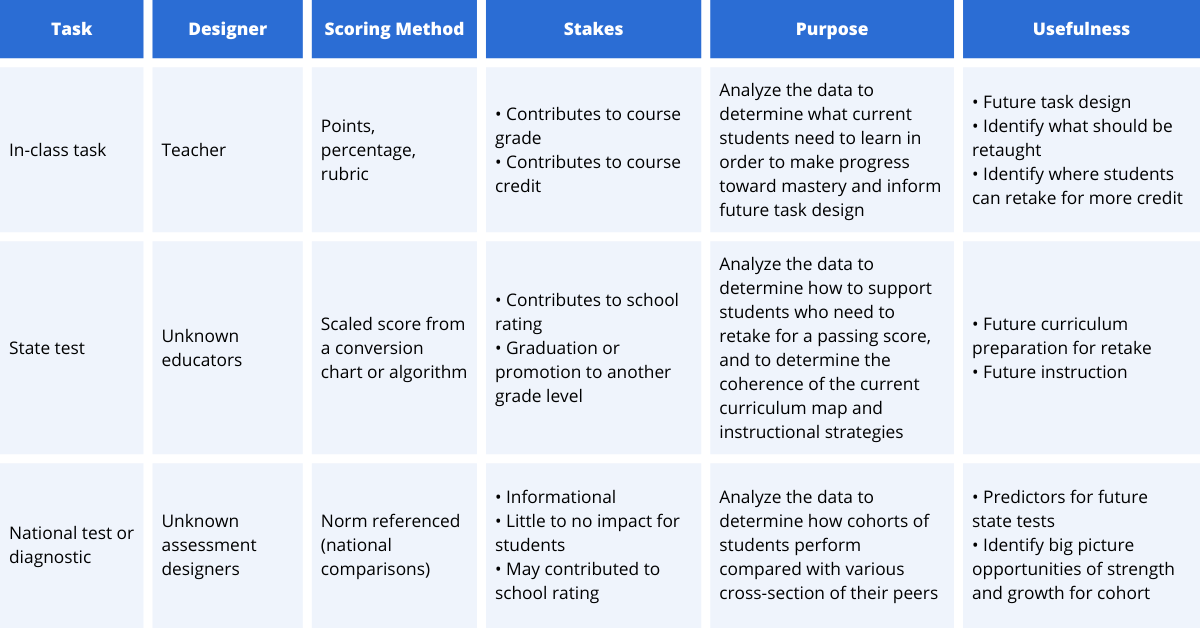
Let’s start with the basics. When analyzing data, we want to be clear about where the data came from, and how it was produced. We can draw different conclusions and take different action steps if we’re analyzing a task we designed, or analyzing results from a national diagnostic.

For example, when analyzing an in-class assessment, if the teacher realizes that most of their students missed question #3, they can look at question #3 and realize that it’s confusing and rewrite it for a future exam, or eliminate it from the students’ grades. However, if they’re analyzing question #3 from a state test, they have no control over the question or its wording and they can’t eliminate it from their students' grade.

Knowing where the data comes from, who designed the task, how the task was scored, and the stakes connected to the data will help us determine our purpose for the analysis and the usefulness of the data. 
Picture

When was the data collected?

Another key factor we want to be aware of is the time between when the data was collected and when it’s being analyzed. If the data has been collected and analyzed in real-time (within a few days or weeks of the assessment) the results of the data analysis may be immediately applied. This is most commonly seen after analyzing in-class formative assessments, exit tickets, or in-class tests or quizzes. Teachers can use the findings of their analysis to identify the needs that emerged and course correct for their students in real time. 

It’s not uncommon for data analysis to take place well after the assessment was completed. This is especially true for state tests, national diagnostics, or other formal assessments. When several months or more have passed, the data becomes more like an artifact from the past, rather than real-time information of what specific students know and can do. Artifacts can be extremely insightful and help us to see patterns and trends that might have been obscured at the time the assessment was taken. When looking at data collected in the past, we can use it as a snapshot of a specific point in time and consider what is the same and what has changed since the data was collected. 

Whose data is it?

Next, we want to consider whose data we’re analyzing. Are we looking at current students in our class, who we’ll see in person within the next week? Are we looking at former students who’ve left our class and have moved on to their next learning experience? Are we looking at a larger picture of students we’ve never taught before and aren’t likely to encounter personally? 

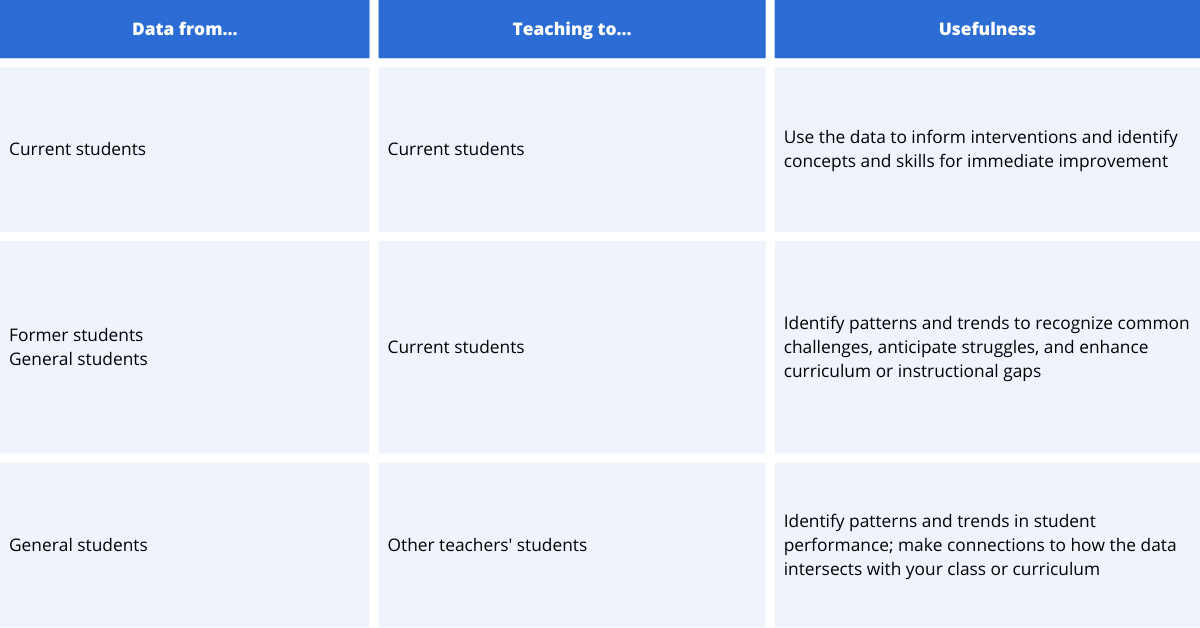
When thinking about the “who” of data, we want to consider the students whose performance generated the data, who we’re teaching now, and how understanding the data will help us refine our practice for our current students, even if we never taught the students whose data we’re analyzing, and we never will. A helpful paradigm for this might be, data from... and teaching to…
Picture

Analyzing multiple choice data

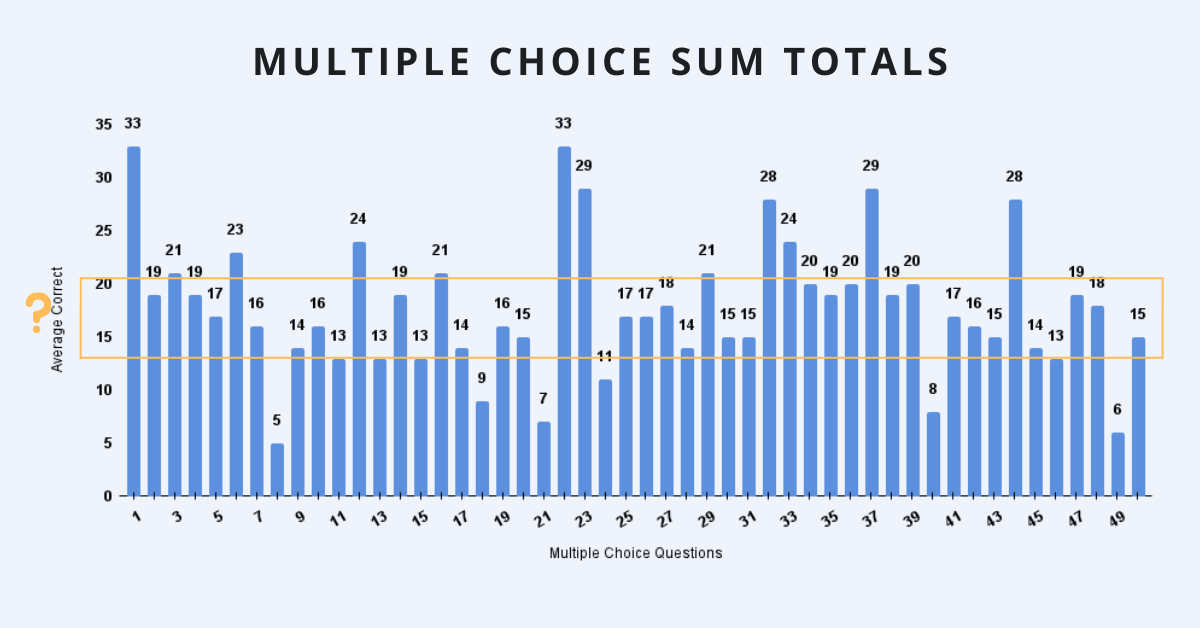
Once we are grounded in the basics — when we understand where the data comes from, when it was collected, and who our instruction is targeted towards — we’ll have some direction and purpose for looking at multiple choice results. To make sense of the data, and to use the information strategically, we can consider our next steps based on the following scenarios:
​
  • 75% or more students answered a multiple choice question correctly
  • 75% or more students answered a multiple choice question incorrectly
  • There was a 50/50 split between correct and incorrect answers

Picture
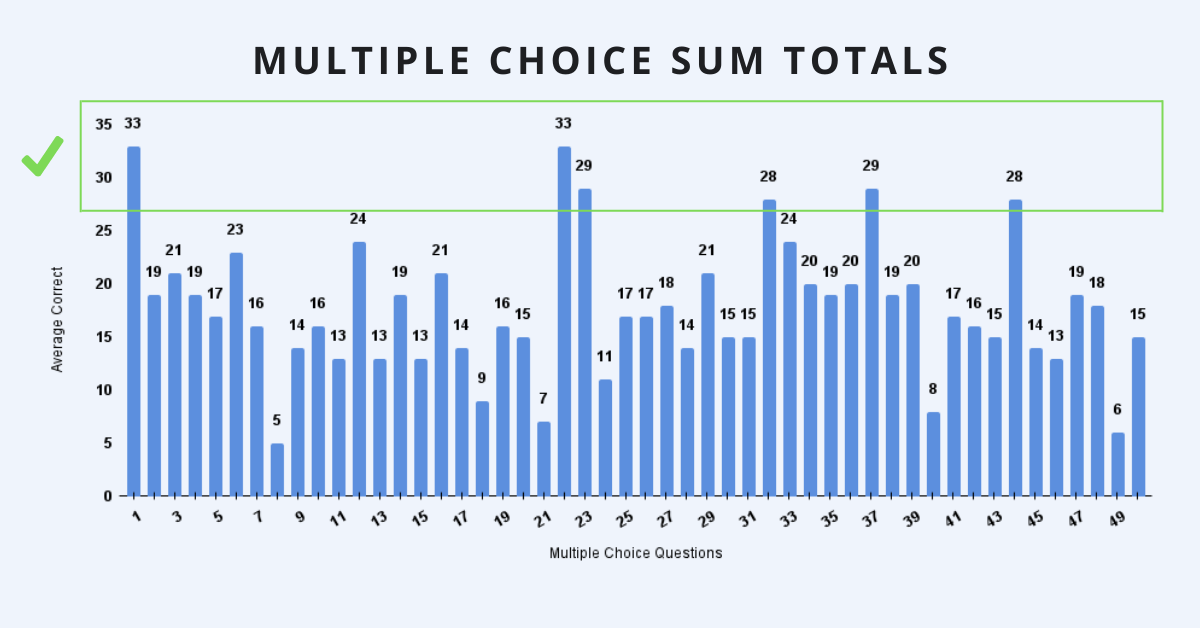
75% or more students answered a question correctly
Picture
DATA FROM...
Whether it’s a spreadsheet of numbers or infographics that reflect the data in charts or other visual models, one of the first trends to examine emerges with questions that most students (75% or more) answered correctly. These questions help us to identify the key content or skills that are present in the curriculum, and were taught so effectively that most of the students in the cohort were able to answer correctly during the exam.

​
CRITICAL QUESTIONS
When we’re analyzing the data to inform our future curriculum mapping and instruction of students in the future, we want to reflect on where and how these concepts show up in our curriculum and put a star next to them. We may examine the instructional methods that were used here and see if we can expand these practices to other topics in the course. 

As we review these correct answers we can ask ourselves:
  • What did students need to know and do in order to identify the correct answer? 
  • When was this content covered in the curriculum?
  • What instructional strategies were used to teach this content?


TEACHING TO...
If we’re analyzing data from current students, in preparation for these students to take the same or similar exam again in the future, we’ll also want to take a close look at the students who got these questions wrong. Narrowing down that <25% of students who answered the questions incorrectly, when everyone else in the class answered correctly, helps us to identify students who are in need of an immediate intervention. These questions reveal that while everyone else was able to learn and apply the content taught in class on the test, this group of students continued to struggle. These concepts won’t be a good use of class time to review for all students, but with the data we can identify the specific students who will benefit from some increased support and reflection on their learning.

Picture
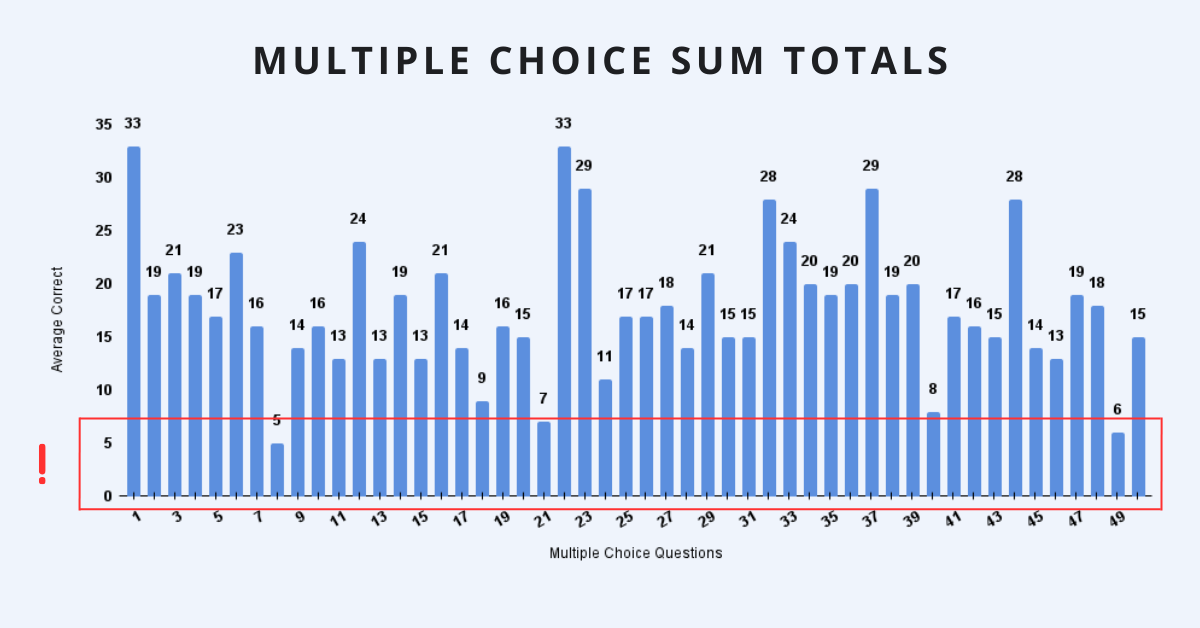
75% or more students answered a question incorrectly
Picture
DATA FROM...
After reviewing what most students answered correctly, we can then turn our attention to where most students answered incorrectly. When 75% or more of our students got the answers wrong, it does point to a potential gap in our curriculum or instructional methods.


CRITICAL QUESTIONS
As we review the incorrect answers, we can ask the same questions as before:
  • What did students need to know and do in order to identify the correct answer? 
  • When was this content covered in the curriculum?
  • What instructional strategies were used to teach this content?

Our answers to these questions will reveal topics that perhaps we didn’t cover but needed to, or places where maybe our instruction was rushed or hurried and students didn’t have a memorable experience to take with them into the exam. 

When we analyze the data to inform our future curriculum mapping and instruction, these questions will help us better understand where we need to make revisions to the learning sequence, pacing, or focus in our future instruction. They may reveal instructional strategies that were less effective, or a change in the assessment expectations that can be translated into curriculum planning. 


​TEACHING TO...
When analyzing the data to inform current instruction for students who can retake the exam, these questions reveal the topics or skills that the whole class would benefit from reviewing or re-learning. More specifically, when we examine the specific answers the students gave (did everyone choose the same wrong answer? Did they choose different wrong answers? What does their response tell us about their misconception?), we can identify misconceptions and use that information to focus our instruction moving forward. 

Picture
50/50 split between correct/incorrect answers
Picture
DATA FROM...
The third step for analyzing multiple choice data is to examine the questions that split our class into two groups. When around half of the class got the question correct, and the other half got the question incorrect, the question highlights content and skills that often mark the difference between students who are just barely passing or just barely failing. Since we see that at least half of the students answered the question correctly, we can have some assurance that this content was taught, but that not all students were able to internalize the concepts or recall them on the day of the test.


CRITICAL QUESTIONS
When we encounter these questions we can ask: 
  • What did students who answered correctly understand that the students who answered incorrectly misunderstood?
  • What prior knowledge or connections did the students need in order to answer correctly?
  • What, if any, pieces of this information can be used to reteach or redesign instruction in the future?


TEACHING TO...
When analyzing the data for current students who have an opportunity to retake the assessment, it is useful for students to reflect on their responses and have another opportunity to resolve misconceptions. 

When analyzing the data for future students, these questions are triggers for content that needs more time, differentiation, or strategic instruction. These questions are key for seeing the tipping point between students who are meeting exam expectations and students who are close to doing so, but can’t quite make it yet.

​When we take time to analyze student performance on an in-class assessment, state exam, or national diagnostic, we’re really taking the time to invest in our own learning. The more we can identify, recognize, and even predict the patterns and trends in student performance, the more we have to work with when we’re in the planning process.

Beyond simply helping us develop more effective curriculum maps and instructional methodology, data offers us the opportunity to use this information with current students who will be retaking the exam in the future, building a blueprint of concepts and skills they need to develop in order to meet their target goals. Examining the data from all three vantage points gives us the perspective we need to make strategic choices in the future. 
​
Picture
Picture
WHEN TO REVEAL THE RIGHT ANSWERS
Picture
YOU HAVE DATA. NOW WHAT?
Picture
​THE F.A.C.T.S. ABOUT GRADING
Comments
    ←  BACK TO ALL ARTICLES

    Picture
    SEARCH BY TOPIC
    21st century skills
    Adult learning
    Assessment & testing
    Classroom culture & SEL
    Classroom management
    CRSE / CRSP
    Curriculum
    Data-driven instruction
    Growth & goals
    Leadership & teams
    Literacy
    Project-based learning
    Rigorous instruction
    Student engagement

    Picture
    Picture
    Picture
    Picture
    Picture

    Picture
    Get started
Picture
The Center for Professional Education of Teachers (CPET) at Teachers College, Columbia University is committed to making excellent and equitable education accessible worldwide. ​CPET unites theory and practice to promote transformational change. We design innovative projects, cultivate sustainable partnerships, and conduct research through direct and online services to youth and educators. Grounded in adult learning theories, our six core principles structure our customized approach and expand the capacities of educators around the world.

ABOUT US

525 West 120th Street, Box 182
New York, NY 10027
​416 Zankel

Ph: (212) 678-3161
[email protected]

Our Team
Career Opportunities
EDUCATOR RESOURCES

Book of the Month
Online Courses
Professional Articles
Ready-to-Use Resources
Teaching Today Podcast
COACHING SERVICES

Custom Coaching
Global Learning Alliance
Literacy Unbound
​New Teacher Network
Student Press Initiative
MAKE A DIFFERENCE

​​Every gift is an investment in equitable education. With your support, we can continue to bring transformative change for K-12 teachers, leaders, and students worldwide. 
Donate

  • Home
  • Who We Are
    • Our Team
    • Our Partnerships
    • Our Authors
    • Principles of Practice
    • Job Opportunities
  • What We Do
    • Services
    • Equity in Action
    • Literacy Unbound Summer Institute
    • Signature Initiatives >
      • Literacy Unbound
      • New Teacher Network
      • Student Press Initiative
  • Educator Essentials
    • Book of the month
    • Online Courses
    • Professional Articles
    • Ready-to-use Resources
    • Teaching Today Podcast
  • Support CPET