|
How one school's teacher leaders are cultivating curiosity and creating a roadmap for meaningful change.

In a recent professional development session at a high school in Georgia, I aimed to enhance a group of leaders' understanding and use of inquiry in their practice. Guiding teacher leaders through an exploration, I encouraged them to reflect on the everyday significance of inquiry within their professional roles, emphasizing its promise in driving practical growth and development. Together, we engaged in a reflective dialogue that included delving into the process of inquiry, unpacking its intended purpose, and highlighting its importance in fostering a culture of continuous improvement within the school community.
The importance of inquiry
What exactly is inquiry, and how does it enhance the work of teacher leaders? Inquiry, simply put, involves deepening understanding through curiosity, questioning, and seeking answers, supported by data analysis. It serves as a means for collaborative exploration, enabling educators to address shared challenges, develop effective strategies informed by data insights, and monitor progress towards common goals. Through this process, teacher leaders not only enhance their own practice, but also foster a culture of evidence-based decision-making within their school communities.
Central to this exploration are inquiry teams, which consist of professionals coming together in their quest for understanding and improvement. These teams operate based on the principle of intentional collaboration, prioritizing issues relevant to their roles and responsibilities. This approach ensures that inquiry projects remain manageable and grounded, enabling teams to achieve tangible outcomes. Moreover, it cultivates a culture of shared responsibility and commitment, fostering an environment that promotes collective growth and progress. Navigating the stages of inquiry
One notable framework that supports inquiry with teacher leadership is our Straight As protocol. This serves as a structured approach for navigating the stages of inquiry, guiding educators through a systematic process of goal setting, knowledge acquisition, assessment, analysis, and adjustment.
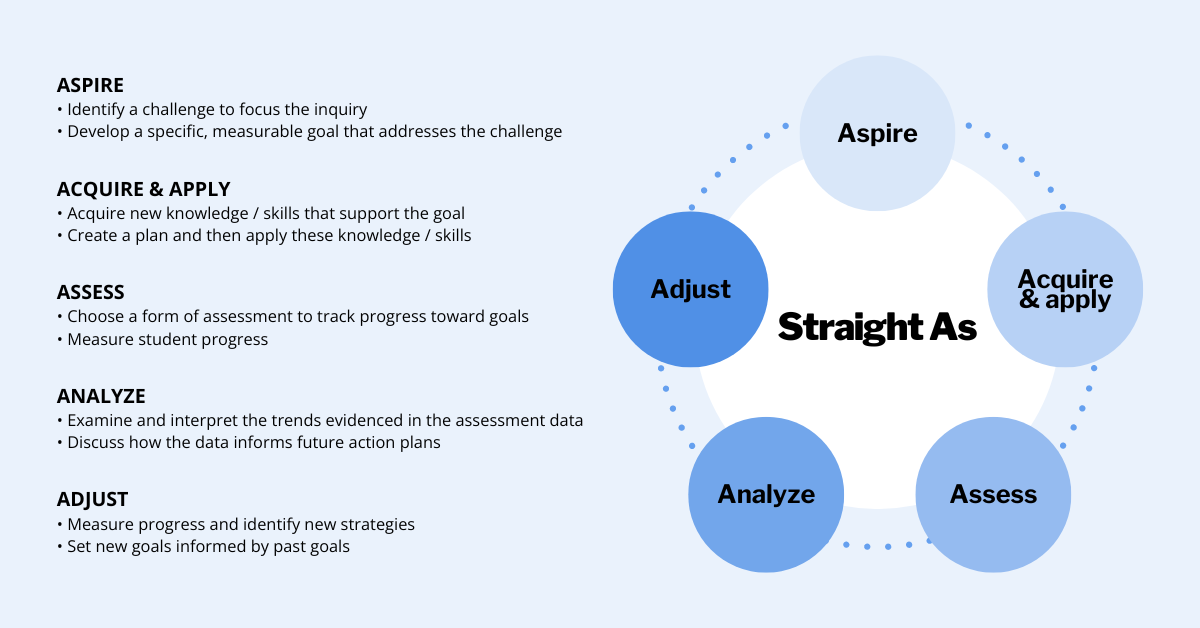
Our initial session in Georgia was focused on the Aspire stage, where teacher leaders chose to explore the challenges faced by their students and collaboratively identify SMART goals — goals that are specific, measurable, actionable, relevant, and timely. Teachers identified challenges such as stamina, confidence, literacy, Lexile levels, and more. From there, we analyzed these challenges and attempted to narrow down our list by thinking about which obstacles could be combined, as well as which obstacle(s) felt the most important, the most urgent, or were in a high-leverage area. Through a process of reflection and dialogue, each department gained a clear understanding of their objectives and a roadmap for achieving them.
During our time together, we thoroughly analyzed various SMART goal examples, focusing on key aspects, such as:
We also examined sample inquiry questions, proposed change strategies, and the anticipated timelines. This comprehensive approach aimed to equip teacher leaders with the necessary insights and tools to effectively formulate their own goals. At the end of the day, each department presented their SMART goals for feedback, fostering collaboration and refinement. As a next step, our group of teacher leaders will present these goals to their respective department teams with the hopes of further refinement and integration into a larger inquiry process throughout the semester as we continue our work together.
The process of inquiry provides teacher leaders with a practical approach to deepen their understanding, collaborate effectively, and drive meaningful change within their school communities. By embracing the principles of inquiry and utilizing frameworks like the Straight As protocol, educators can see themselves as catalysts for positive change, enhancing their teaching practices and empowering their students. Moreover, by incorporating data analysis into the inquiry process, educators can make informed decisions based on evidence, thereby increasing the effectiveness of their strategies and interventions.
Look beyond traditional forms of data to choose a co-teaching approach that aligns with your students' needs and goals.

Throughout my time as a coach at CPET, I’ve done a lot of professional development around co-teaching, and one problem I face is this: teachers, ever the committed and curious group, often want to try out whatever co-teaching approach we’re modeling and discussing right away — like in the next day’s lesson.
You might be wondering: wait, why is this a problem? And I agree — this is a pretty good “problem” to have. I am so heartened when teachers exhibit this kind of eagerness and openness. At the same time, I worry that professional development on co-teaching can sometimes be interpreted as a “bag of tricks” to try and apply at random. We must remember that not all co-teaching models are equally effective in any given situation; we must select them thoughtfully and intentionally with our specific students, context, and content in mind. Ideally, and as much as possible, we want to choose a co-teaching approach based on a) our learning goals for students and b) what our data tells us about students’ relationship to those goals. What do I mean by data?
Before I offer some specifics, I have to admit something: my former self — my early-career classroom teacher self — might have rolled my eyes at my current-coach-self writing an article on data-informed co-teaching. This is because I had a very narrow definition of data; I associated the word only with the scores that resulted from high-stakes and standardized testing. As a Special Education teacher, I was committed to seeing my students as more than a number, and so I resisted exclusively quantitative approaches to data analysis.
As a coach, I am still committed to seeing students as more than a test score, but my definition of data has broadened over the years. While quantitative data analysis might have its place, I have come to understand student writing, student surveys, exit tickets, student conferences, and classroom observation as valuable data points that should inform instruction. As you consider the examples below, I encourage you to think of these things as data, too. Using data to choose a co-teaching model
Here is a glimpse into how your classroom data might inform your co-teaching approach. Below are three of the six co-teaching models and how different data insights might lead you to choose that particular model.
You might use Station Teaching if…
You might use Alternative Teaching if….
You might use One Teach, One Observe if…
In reality, there are many factors that inform our decisions about our co-teaching approach: our physical space, our co-teaching relationship, our principal’s preference, or the amount of time we have to co-plan. Content-specific considerations are also crucial; not all lessons would be well-suited for a stations lesson, for example. I am not naive to these factors and the impact they have on teachers’ practices. At the same time, I think it is helpful to remember that our co-teaching approaches should be serving our students, and not the other way around.
Rethink this co-teaching model that, when used thoughtfully, increases teachers' ability to respond to student needs.

Of the six established co-teaching models, One Teach, One Observe is the one that gets a bad rap. In my experience as a coach, working with leadership and teacher teams to make the most of co-teaching, One Teach, One Observe is often the one administrators want to take off the table completely.
“If I’m dedicating the resources of two teachers to one classroom, I want there to actually be two teachers in the room,” is something I often hear, in one way or another. And it’s understandable that there would be an expectation of seeing two teachers actively supporting and interacting with students in a co-taught classroom. At the same time, I would argue that when used strategically and thoughtfully, the One Teach, One Observe model is a powerful tool for formative assessment and data-informed teaching. Unfortunately, there are some common misconceptions that cloud our understanding of the model and prevent us from using it as such. Here are some common myths around One Teach, One Observe worth busting. 
One Teach, One Observe means we’re primarily observing the other teacher to see what they do.
Often, I see or hear the model suggested for newly established co-teaching teams — as a way for the newer teacher to get to know the style and practices of the more seasoned teacher, or as a way to learn from their expertise. While one could make a case for this in certain contexts, it’s clear that this diverts effort and attention from the students in the room — the opposite of our goals in a co-taught classroom. Instead, students should be the focus of our observations; the observing teacher collects data around how students are responding to information or engaging in classroom work.
The power of observation in the classroom is often acknowledged and discussed, but focused and sustained observation can feel like a pie-in-the-sky expectation when teachers face so many demands for their attention: a student comes in late and needs catching up, attendance is due, a video needs to be cued for the next portion of the lesson, two students need help settling a disagreement. The list goes on. This is the beauty of having two teachers in the room: one teacher can attend to these needs, while the other remains zeroed in on collecting the important data. 
The One Teach, One Observe model doesn’t require any planning or coordination amongst co-teachers.
While it is true that the One Teach, One Observe model may require less planning than other models — and can be an option when co-planning is just not possible — communication and preparation are required for using this model to its fullest potential. First, co-teachers must decide — ideally together — that a particular lesson or lesson section provides an important opportunity to learn more about students’ current understandings or performance with particular concepts or skills; it is important to remember that our goals for student learning inform our choices around co-teaching approaches, and not the other way around.
Second, we must decide the specific skills, understandings, or academic habits on which to focus our observations. In Teach like a Champion 2.0, Doug Lemov discusses the difference between simply “watching” students as they work, and “tracking” their progress through observation, with the latter meaning “the active seeking of the most important indicators of learning” (p. 45). In preparing to collect observational data during a lesson, we must ask ourselves: what specifically in students’ work or discussion will show me that they are “getting it”? We then must determine and prepare an easy-to-maintain system for tracking those specific “look-fors” (e.g. a list of student names, with a place to make a hash mark every time they refer to the map in their discussion on geographic factors). Perhaps the most coordination and preparation, however, comes with deciding what to do with the observational data once it’s collected — that is, how it will be used to make instructional decisions. Co-teachers might decide ahead of time that the data will be used to inform student grouping in real time; students who need further support with specific skills might work with one teacher in a small group, while the rest of the class continues on with the next learning objective. This requires having materials or teaching points prepared for the small group. Or, if the skills being assessed are not necessarily prerequisite to the day’s lesson, co-teachers might decide to look at the data together at the end of the day to determine differentiation or determine strategic grouping for the next day; perhaps students who would benefit from more practice with a particular skill will have a differentiated task, or the option to spend time at a learning center that supports them with review. In order to support co-teaching teams in all phases of planning, I have created an observational planning template to guide teachers in the before, during, and after of collecting observational data. 
One Teach, One Observe means one teacher is observing for the entire lesson.
This is a myth that applies to all the co-teaching approaches — that co-teachers should stick to one model for an entire lesson — when in reality, hybridizing or sequencing multiple models within a lesson is often the way to more effectively leverage them for student success.
This remains true in relation to the One Teach, One Observe model — if we are intentional and targeted in the type of data we are collecting, it is unlikely that observation is necessary for an entire lesson, anyway. Consider using this model at strategic points throughout a lesson — while students complete a Do Now activity, or for the first problem or question they are answering independently. This will free the second teacher up to provide more interactive support for the remaining time. 
The Special Education teacher should always be the one observing.
One of the drawbacks of the One, Teach, One Observe model — especially when used inflexibly or too often — is that one teacher might be relegated to an “assistant” role in the eyes of the student, a consequence we know can negatively impact classroom culture and dynamics. One way to mitigate that risk is to alternate the teacher observing and the teacher leading. This way, students see both teachers as instructional leaders, and both teachers have the opportunity to gain valuable insight through observation.
With two teachers in the classroom collaborating and working together toward student learning, the opportunities to respond to students’ needs increase dramatically. Observation is a relatively simple tool that becomes powerful when utilized thoughtfully by teacher teams.
Promising practices for assessing and adjusting your instruction to meet students' needs.

Data is often thought of as comprehensive spreadsheets consisting of numbers, graphs, and charts, representing scores from end of unit tests or standardized exams. It’s often analyzed to determine whether or not students have mastered content and skills, rather than inform instruction or translate into timely teacher moves in the classroom.
Quantitative data has its place; however, it alone does not suffice. In addition to charts and graphs, teachers need qualitative data to inform and adjust their instruction along the way — throughout the unit, and within particular lessons. So, what are some of the ways teachers can gather this kind of data and make use of it? What can it look like?
A portrait of practice
In a recent visit to a school in Georgia, a colleague and I had the opportunity to perform walkthroughs of select classrooms. One teacher I witnessed — a seasoned math teacher facilitating a lesson on solving equations with decimals — was doing a fantastic job of taking the pulse of her classroom and assessing the needs of her students throughout her lesson. I want to share what I observed as I think it can be a useful case study to help us answer the above questions. She posed a question for the do now, and after circulating to assess how her students were doing, she addressed the class: “Okay y’all, I want us to stop for a minute. I’m noticing that what is tripping us up with this problem is rounding, and I would hate for this small detail to result in us getting these types of problems wrong!” From there, she asked students to look back at their problem, particularly to see if they rounded correctly, while she prepared the next step of the lesson on her computer. After a few more minutes, she asked the students to go back to their seats, and informed them that they were going to engage in a Kahoot, to provide more practice with rounding. (Kahoot is a wonderful tool for not only offering practice, but also for gathering data quickly and accessibly. After each question, Kahoot offers a chart indicating how many students selected which answer and whether or not it was the right answer.) This was a simple and effective way to gather and use data in the moment, in order to shift the plan for the day’s instruction. Rather than push forward, she took stock of what was needed, and responded intentionally. And it didn’t stop there. As the lesson progressed, she continued to gather data while students were working, and made shifts based on what she observed. I watched her create a few different groups based on the information she had: one for students that needed more rounding practice; another group that focused on the original practice problems for the day; and another group that was pushed with some more challenging questions based on their strengths. This case study offers some promising practices for gathering and analyzing data, and making in the moment adjustments to instruction. In addition to the practices I described, I want to offer a few more that I utilized while I was leading my own classroom.
Turn and talks
Turn and talks are an effective means of assessment that I leaned on heavily during my time as a classroom teacher. Given my large class size, turn and talks allowed me to check for understanding with more students than I could if they were working independently. I often used turn and talks as part of a do now, where I would pose a question and then have students talk to a shoulder partner while I circulated and listened in on their conversations. Additionally, I liked to use turn and talks as part of a guided practice where I would model a strategy and then have students try it out with a partner while I listened and observed. I sometimes used a checklist to make note of which students seemed to be getting it and which students might need some more support, to inform how I might group my students for the lesson and inform who I might need to conference with individually.
Conferencing
Conferencing is another powerful formative assessment that can be very instructive for both teachers and students. Conferences, when executed effectively, involve looking at student work, asking some clarifying and/or probing questions to determine what a student needs, in the moment, as they practice a new skill. Based on this investigation, the teacher identifies a high-leverage strategy that can advance student learning, often models it, and then observes while students give it a try.
Collecting and sorting student work
Lastly, collecting and sorting student work is an effective means of assessment that can be particularly informative for sequencing instruction. As an elementary teacher, I would make it a point to collect student work once a week, whether it was students’ writing notebooks, their reading post-its, their drafts of writing, etc. I would look closely at the work to try and determine strengths and struggles, and then identify any common trends that could inform my grouping as well as the goals I should set for these groups. For example, if we were working on a writing unit focused on non-fiction essays, I might review student work and notice common challenges related to students supporting their thinking with evidence, using proper citations, analyzing the evidence to make connections to their claims, etc. I would sort the challenges, and attempt to narrow them down to three or four that would form my groups, and then identify a teaching point for each that I would implement the following week. It often felt like a lot of work, but when I did it, I always found it enlightening and I appreciated how it pushed me to ensure I was catering my instruction to what my students truly needed. (A twist of this for middle and high school teachers could be to collect and sort exit tickets, as they are likely more manageable than collecting drafts.)
As teachers, we need to understand and address our students' needs as they arise, as they engage in the learning process and acquire new skills. In doing so, we can reflect on and improve our instruction before it’s too late. What I hope I have provided are meaningful and manageable ways to gather qualitative data and make use of it in the moment and beyond.
How to recognize patterns in student performance as you take your next steps toward strategic instruction.

Analyzing data from high-stakes exams is:
Answer: D — All of the above While promising practices for using data to inform instruction are well intentioned, the process and impact often misses the mark. It can become an overwhelming and confusing experience that can pull educators into sinkholes that produce unreliable conclusions and eat up valuable time and resources. How can we yield the benefits of data analysis and avoid these drawbacks? Analyzing data is valuable because it helps us zoom out from individual results to recognize the patterns and trends in performance, so that we can make choices in the future that will benefit our students. But depending on the type of data we’re analyzing, and the purpose, how we approach the analysis and the conclusions we draw can change dramatically.
Where did the data come from?
Let’s start with the basics. When analyzing data, we want to be clear about where the data came from, and how it was produced. We can draw different conclusions and take different action steps if we’re analyzing a task we designed, or analyzing results from a national diagnostic. For example, when analyzing an in-class assessment, if the teacher realizes that most of their students missed question #3, they can look at question #3 and realize that it’s confusing and rewrite it for a future exam, or eliminate it from the students’ grades. However, if they’re analyzing question #3 from a state test, they have no control over the question or its wording and they can’t eliminate it from their students' grade. Knowing where the data comes from, who designed the task, how the task was scored, and the stakes connected to the data will help us determine our purpose for the analysis and the usefulness of the data. 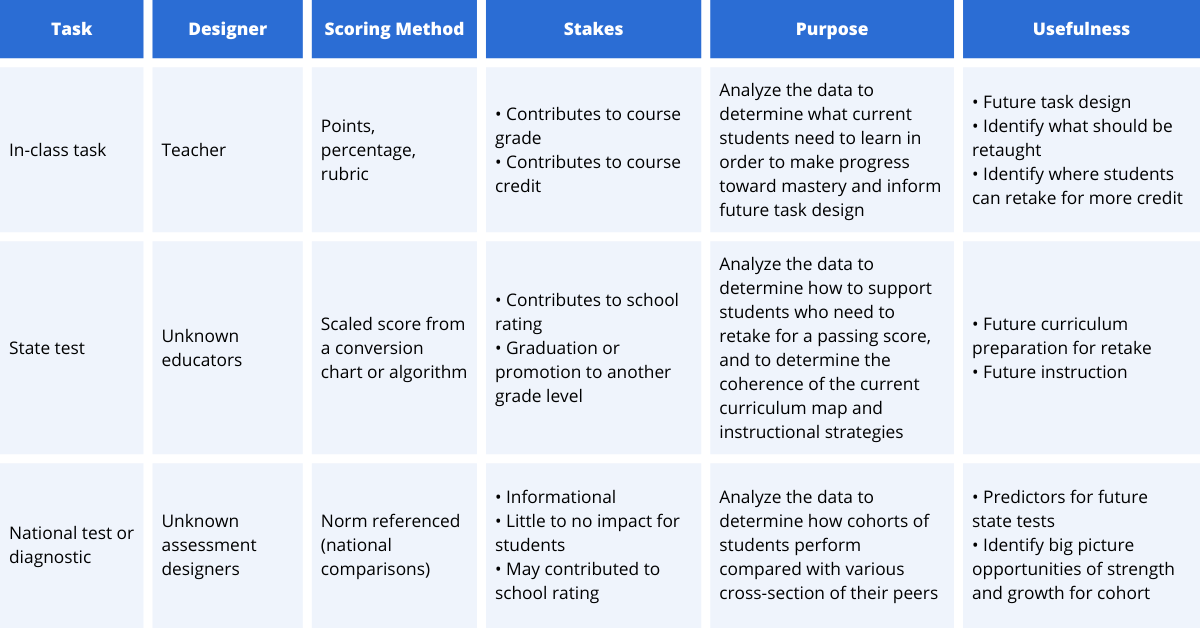
When was the data collected?
Another key factor we want to be aware of is the time between when the data was collected and when it’s being analyzed. If the data has been collected and analyzed in real-time (within a few days or weeks of the assessment) the results of the data analysis may be immediately applied. This is most commonly seen after analyzing in-class formative assessments, exit tickets, or in-class tests or quizzes. Teachers can use the findings of their analysis to identify the needs that emerged and course correct for their students in real time. It’s not uncommon for data analysis to take place well after the assessment was completed. This is especially true for state tests, national diagnostics, or other formal assessments. When several months or more have passed, the data becomes more like an artifact from the past, rather than real-time information of what specific students know and can do. Artifacts can be extremely insightful and help us to see patterns and trends that might have been obscured at the time the assessment was taken. When looking at data collected in the past, we can use it as a snapshot of a specific point in time and consider what is the same and what has changed since the data was collected.
Whose data is it?
Next, we want to consider whose data we’re analyzing. Are we looking at current students in our class, who we’ll see in person within the next week? Are we looking at former students who’ve left our class and have moved on to their next learning experience? Are we looking at a larger picture of students we’ve never taught before and aren’t likely to encounter personally? When thinking about the “who” of data, we want to consider the students whose performance generated the data, who we’re teaching now, and how understanding the data will help us refine our practice for our current students, even if we never taught the students whose data we’re analyzing, and we never will. A helpful paradigm for this might be, data from... and teaching to… 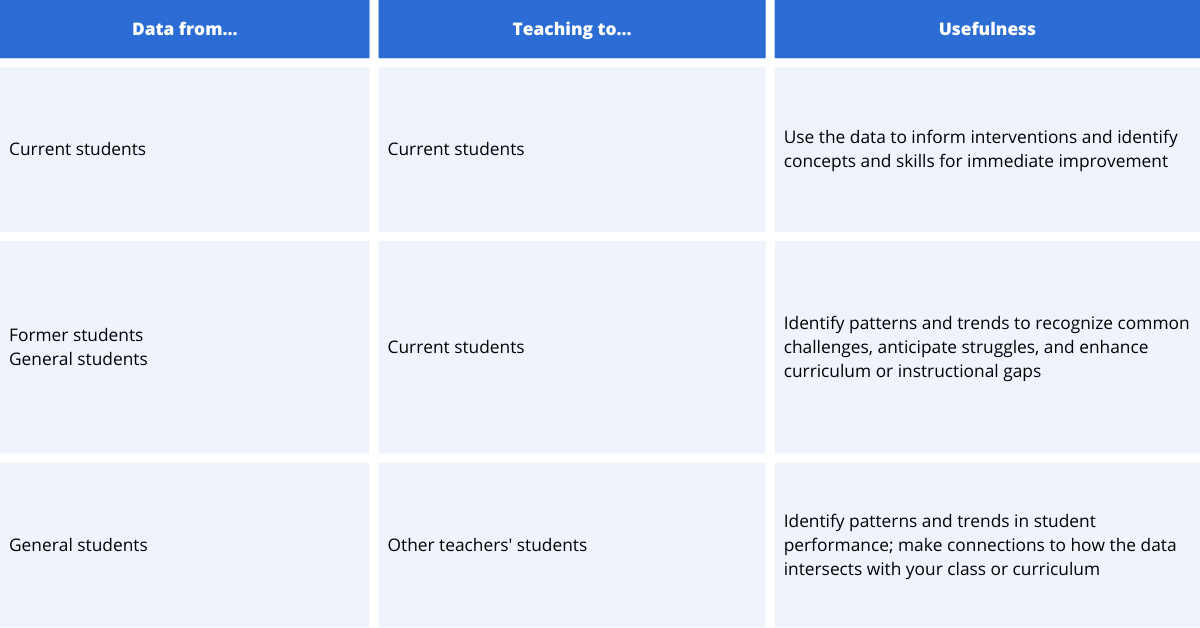
Analyzing multiple choice data
Once we are grounded in the basics — when we understand where the data comes from, when it was collected, and who our instruction is targeted towards — we’ll have some direction and purpose for looking at multiple choice results. To make sense of the data, and to use the information strategically, we can consider our next steps based on the following scenarios:

75% or more students answered a question correctly
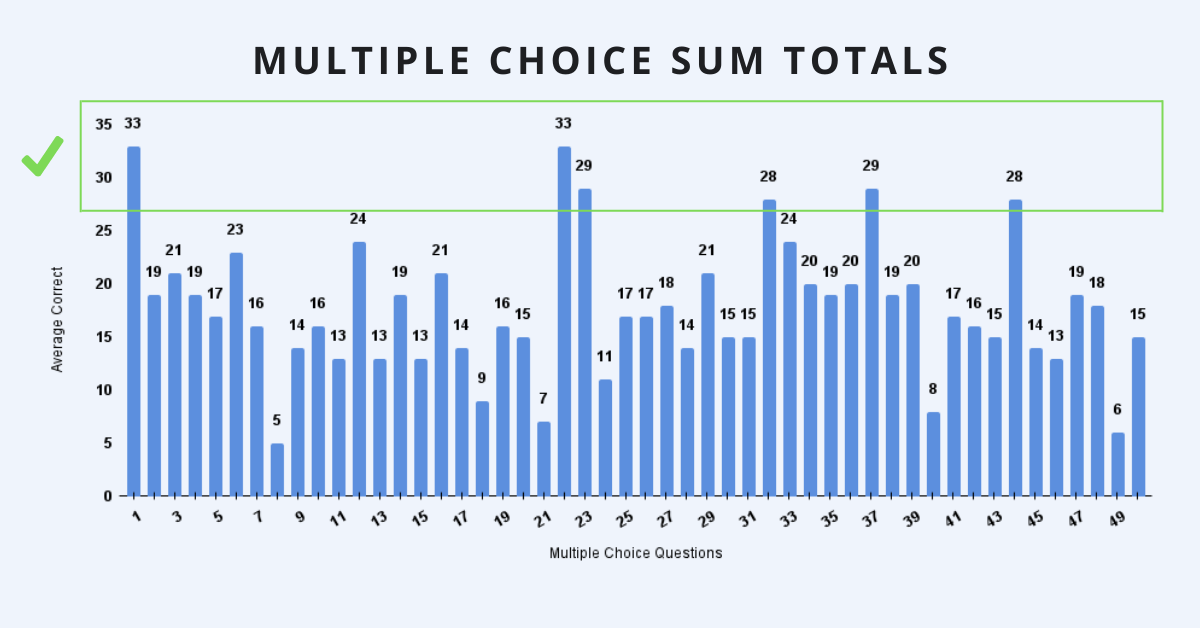
DATA FROM...
Whether it’s a spreadsheet of numbers or infographics that reflect the data in charts or other visual models, one of the first trends to examine emerges with questions that most students (75% or more) answered correctly. These questions help us to identify the key content or skills that are present in the curriculum, and were taught so effectively that most of the students in the cohort were able to answer correctly during the exam. CRITICAL QUESTIONS When we’re analyzing the data to inform our future curriculum mapping and instruction of students in the future, we want to reflect on where and how these concepts show up in our curriculum and put a star next to them. We may examine the instructional methods that were used here and see if we can expand these practices to other topics in the course. As we review these correct answers we can ask ourselves:
TEACHING TO... If we’re analyzing data from current students, in preparation for these students to take the same or similar exam again in the future, we’ll also want to take a close look at the students who got these questions wrong. Narrowing down that <25% of students who answered the questions incorrectly, when everyone else in the class answered correctly, helps us to identify students who are in need of an immediate intervention. These questions reveal that while everyone else was able to learn and apply the content taught in class on the test, this group of students continued to struggle. These concepts won’t be a good use of class time to review for all students, but with the data we can identify the specific students who will benefit from some increased support and reflection on their learning. 
75% or more students answered a question incorrectly
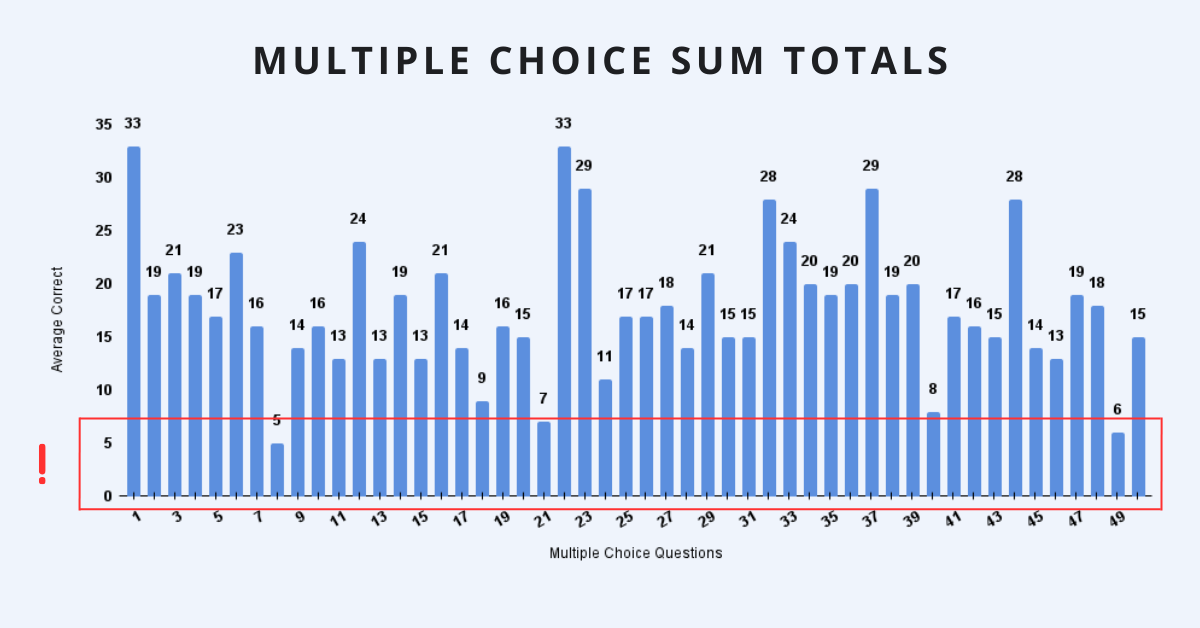
DATA FROM...
After reviewing what most students answered correctly, we can then turn our attention to where most students answered incorrectly. When 75% or more of our students got the answers wrong, it does point to a potential gap in our curriculum or instructional methods. CRITICAL QUESTIONS As we review the incorrect answers, we can ask the same questions as before:
Our answers to these questions will reveal topics that perhaps we didn’t cover but needed to, or places where maybe our instruction was rushed or hurried and students didn’t have a memorable experience to take with them into the exam. When we analyze the data to inform our future curriculum mapping and instruction, these questions will help us better understand where we need to make revisions to the learning sequence, pacing, or focus in our future instruction. They may reveal instructional strategies that were less effective, or a change in the assessment expectations that can be translated into curriculum planning. TEACHING TO... When analyzing the data to inform current instruction for students who can retake the exam, these questions reveal the topics or skills that the whole class would benefit from reviewing or re-learning. More specifically, when we examine the specific answers the students gave (did everyone choose the same wrong answer? Did they choose different wrong answers? What does their response tell us about their misconception?), we can identify misconceptions and use that information to focus our instruction moving forward. 
50/50 split between correct/incorrect answers
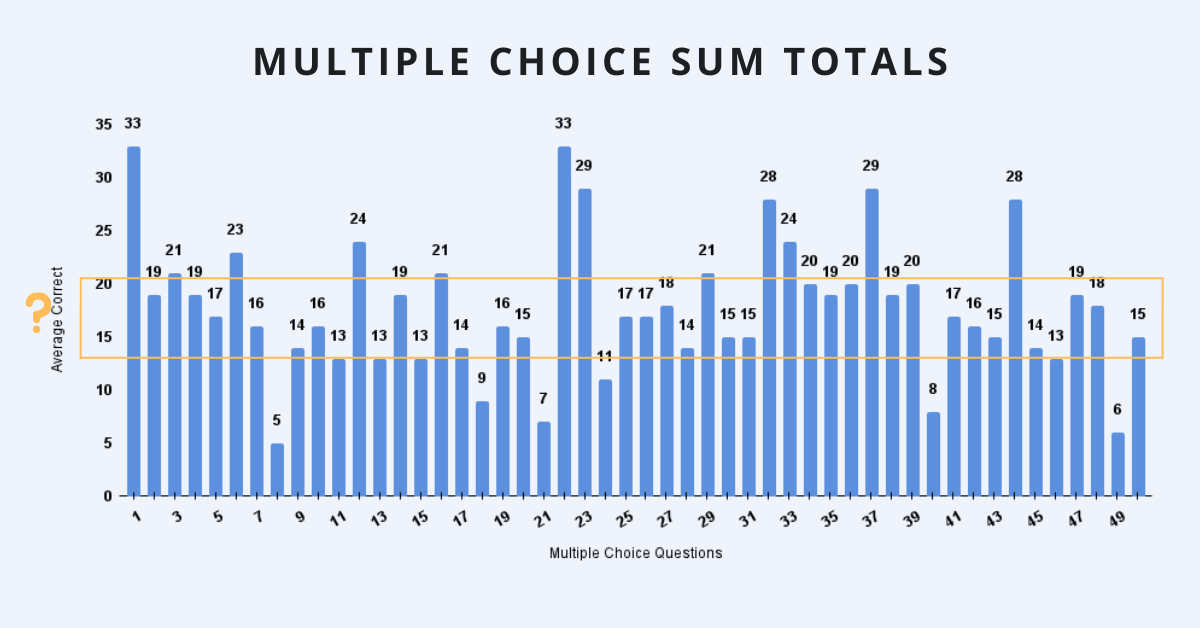
DATA FROM...
The third step for analyzing multiple choice data is to examine the questions that split our class into two groups. When around half of the class got the question correct, and the other half got the question incorrect, the question highlights content and skills that often mark the difference between students who are just barely passing or just barely failing. Since we see that at least half of the students answered the question correctly, we can have some assurance that this content was taught, but that not all students were able to internalize the concepts or recall them on the day of the test. CRITICAL QUESTIONS When we encounter these questions we can ask:
TEACHING TO... When analyzing the data for current students who have an opportunity to retake the assessment, it is useful for students to reflect on their responses and have another opportunity to resolve misconceptions. When analyzing the data for future students, these questions are triggers for content that needs more time, differentiation, or strategic instruction. These questions are key for seeing the tipping point between students who are meeting exam expectations and students who are close to doing so, but can’t quite make it yet.
When we take time to analyze student performance on an in-class assessment, state exam, or national diagnostic, we’re really taking the time to invest in our own learning. The more we can identify, recognize, and even predict the patterns and trends in student performance, the more we have to work with when we’re in the planning process.
Beyond simply helping us develop more effective curriculum maps and instructional methodology, data offers us the opportunity to use this information with current students who will be retaking the exam in the future, building a blueprint of concepts and skills they need to develop in order to meet their target goals. Examining the data from all three vantage points gives us the perspective we need to make strategic choices in the future.
A four-step process for jumpstarting your analysis.

Picture this: you just learned that you have access to your students’ test scores, or the standardized tests they took last year, and you are tasked with “analyzing the data.” You know your goal is to use those scores to inform your instruction, but what do you do? And where do you start?
Don’t panic.
Starting your analysis
As a doctoral student, I always appreciated understanding analysis in this way: “all analysis is basically sorting and lifting” (Ely, Vinz, Downing, and Anzul, p. 162). This visual of sorting and lifting helped me to take action, and not feel stuck or paralyzed by mounds of data that just sits there and does not analyze itself. Enter The 'Tions, a reflection tool that offers a pathway for making meaning out of a data set. With this resource, users can begin to navigate complex information they are charged with analyzing, by exploring four categories:
Using The 'Tions
While there is no single, prescribed way to use this tool, one recommendation is to begin in the top left quadrant — Confirmation — as a way to acknowledge one’s perceptions prior to diving into the data. This not only allows existing assumptions or hypotheses to surface before entering the data, but also nudges the user to begin thinking about the work and tap into prior knowledge. The Inspiration quadrant is a natural next step, as it encourages a fresh way to look at the data. If your data set is not particularly “inspiring,” consider identifying areas in the data that highlight strengths. As you make your way to the Revelation quadrant, don’t be surprised if this reveals similar information that you entered in the Confirmation section. This section will be most meaningful if you can remain open to taking a new perspective on the data at hand. Finally, use the Application quadrant to take into consideration your next steps after looking at the data. Consider how you will use your Inspirations and Revelations to inform practical next steps in your work. What’s a small step that you can take that would make the biggest difference?
Using The ‘Tions as a tool for reviewing data is a start, and can support the user as they begin to lift and sort the information before them. While The ‘Tions will not solve all of your data analysis issues, it will help you get unstuck and begin the important work of looking at data through specific lenses.
Set clear instructional expectations that help elicit students' most quality thinking.

There are many excellent reasons for looking closely at student work. We can look at the work to engage in inquiry around particular students and understand their strengths and struggles across classes and content areas, or we can look at the work of a particular class section in order to create strategic student grouping and inform differentiation for upcoming lessons. Sometimes, looking at student work can be a really meaningful way to reflect on our own instructional and curricular design — especially when we’ve recently created a new learning activity or assessment that we’ve never used before.
Recently, I supported teachers at one of our wonderful partner schools in student work analysis for this purpose. Like many schools across the city, rigor is a focus for professional learning this year. For this particular learning cycle, teachers worked on designing rigorous tasks using the Rigormeter, a resource designed by Dr. Roberta Lenger Kang, which re-envisions Bloom's Taxonomy. For this particular session, teachers were invited to bring two different pieces of student work: one that “met or exceeded expectations” for the task, and one that “is not yet meeting expectations.” Here is a snapshot of what they did with those pieces of student work, and how this reflection will inform next steps. 
What does success look like?
For the first round of reflecting and sharing, teachers spent some time with the piece of work that met or exceeded expectations. Teachers were invited to engage in individual reflection using an iteration of our What / So What / Now What resource, which offers a process for making low-inference observations, analyzing findings, and identifying a course of action.
In this round of reflection, teachers had the opportunity to consider and articulate the success criteria for their rigorous task, and identify the skills and knowledge required for students to produce work that meets or exceeds expectations. Ideally, we’d like to have a clear vision of the success criteria before we ask students to engage in a task, but when we are trying something for the first time, this type of reflection might be necessary to gain further clarity. Let’s say a Social Studies and ENL co-teaching team is trying out a new assignment in which students are asked to plan an educational tour of Greece for the class. They are asked to choose at least three stops on the map and explain why a particular place or geographical feature is important for understanding the ancient culture of the civilization. A What / So What / Now What-style reflection on a successful student’s work might look like:

What are revisions and next steps?
For the second round of reflecting and sharing, teachers moved their attention to the piece of student work that was not yet meeting expectations. Once again, they engaged with a What/So What/Now What protocol, this time with slightly different prompts:
A sample reflection for that same scenario might be:
Insights and next steps
During our whole staff debrief, one common high-level insight that emerged across departments was that we cannot make assumptions about students’ knowledge and skills before assigning rigorous tasks. Thus, a next step in the group’s professional learning will be to explore the concept of formative assessments and their connections to engaging students in work that is appropriately challenging. The whirlwind pace of teachers’ work does not always allow a beat to critically reflect on planning; often after trying something new, we must take stock as quickly as possible and then shift our attention to the next lesson, activity, or assessment. However, when we can carve out space for intentional reflection (and school leaders and PD coaches support us in doing so), there are undeniable benefits — perhaps the most obvious being that we have much better insight into students’ immediate needs. But also, if we understand student work to be a mirror of our own practice — reflecting back ways to improve our own instructional design — looking at what students produce in live time informs how we will design our next learning activity, or how we revise our design for next time so that it elicits students’ most quality thinking.
Exploring the purposeful planning behind creating unbiased opportunities for students to demonstrate their learning.

Equity. A cornerstone of many mission statements, vision statements, and future educational goals. Creating equitable classrooms is essential, but without purposeful and thoughtful planning, it can become overwhelming. So where does our planning begin? At the end: with assessment. In the following conversation with Bob Janes, Secondary Mathematics Supervisor for East Hartford Public Schools in Connecticut, equity in assessment is discussed, and Bob gives educators actionable steps to begin thinking about equity in their own assessments.
Why is it important to ensure that our formative assessments are equitable?
B. Janes: I think it's important to step back and ask ourselves why we assess in the first place. Formative assessments allow teachers to know where a student stands in relation to a learning target and give actionable feedback. Formative assessments also allow students to reflect on their progress and plan next steps.
An inequitable assessment can give the teacher and student a distorted view of that student's learning, which can have lasting negative impacts on a student's learning trajectory. Even worse, an inequitable assessment can cause an otherwise talented student to see themselves as incapable. In a subject such as mathematics, self-efficacy is crucial.
How about summative assessments?
B. Janes: Summative assessments allow multiple stakeholders to reflect on a longer learning progression. In aggregate, summative assessment data can be used to inform large scale decisions including curriculum, instruction, assessment, funding, and staffing. If these assessments are inequitable, they can inform the wrong decisions and breed inequities in other aspects of education.
What makes an assessment equitable?
B. Janes: An assessment is equitable when it allows all students an unbiased opportunity to demonstrate their learning. Below are examples of differences between the features of inequitable and equitable assessments.
I heard you mention that equitable assessments do not take effort and participation into account. Why not?
B. Janes: It goes back to the importance of determining the purpose of an assessment before creating it and checking for alignment again once complete. This ensures the assessment measures what it intended to, and that the conclusions drawn from it are valid.
An assessment designed to test for content standards (e.g. reading for information, graphing a quadratic) should not include effort or participation as a factor in grading because that is not what is being assessed. Some assessments do test for content-based practices, habits, or dispositions (e.g. collaboration, perseverance, problem solving). While this sounds a lot like “effort”, it’s not. A carefully designed assessment that uses a specific rubric can assess these habits or dispositions without grading students for generalized effort or participation.
Equity in our classrooms goes above and beyond this conversation, but thinking about equity in assessment is a great place to start. Equitable assessments can help students reflect on their progress, plan appropriate next steps, and build their self-efficacy, along with allowing educators, administrators, and district leaders to make the best choices for schools.
How the timing of checks for understanding can impact what you learn about student comprehension.

Great teachers want to be sure their students understand content information on a daily basis. They don’t want their students to wrestle with misconceptions, misunderstandings, or mistakes in their thinking that might set them up to struggle as the content unfolds throughout a lesson or unit. As a result, many teachers use small, formative assessments at the beginning, midpoint, or end of a period so students have an opportunity to practice their content and skills, and teachers can assess their understanding at different stages of the learning process. In an effort to ensure that all students have the right answers and a clear understanding of the lesson, many teachers review the correct answers to the assessment before moving on to the next stage of the lesson.
In both examples, we see the teachers making choices that elevate student collaboration, ensuring students have the opportunity to correct misconceptions, connect with one another, and leverage grouping and discussion strategies to process content information. In both examples, the teacher is using a formative assessment — or a check for understanding — with the goal of assessing student comprehension. And in both examples, the check for understanding may be giving teachers more misinformation, than information.
Check for understanding
Well-developed instructional design includes multiple checkpoints to assess student comprehension in real time. Highly effective assessment structures may include between 1-3 checks for understanding in a class period, with each check being an opportunity for students to independently demonstrate their understanding and skills related to the lesson objective or learning target. When we jump from the check for understanding task to the review of direct responses, some unintended consequences may emerge. One likely scenario is that students who had a misunderstanding or a misconception when working on their own will likely copy down the “right answer” during the discussion. But copying down the answer doesn’t necessarily correct their misconceptions. The unintended consequence is that it appears that all the students have the correct answer, even though some may have simply copied down the answer during the discussion. For teachers using formative assessment data to inform their instructional choices, there’s no evidence that helps them know which students had the correct answer at the time of the assessment, which students had an a-ha moment during the discussion, and which are copying down the correct information but are actually still confused. Another unintended consequence is that students discover that the right answers get shared immediately, before their work is completed. It’s a lot easier to copy down the right answers later than it is to work through the hard problem in the moment. Some students may begin to opt out of the learning activity altogether and simply wait for the correct answers. This phenomenon may not be noticeable right away — a gradual disengagement happens slowly over time, and can start with students who appear slow to start, or students who are easily distracted. For teachers feeling the pressure of time, it can be tempting to skip to the right answers even if some students aren’t finished. The challenge is that over time, fewer and fewer students finish the task because everyone is waiting for the right answers to be shared.
Creating space for small changes
The good news is that there are a few small changes that can make a big difference. Add a reflection. In addition to the discussion of the correct answers, ask students to write a reflection comparing their first response to the correct answer, and share if they made any changes to their thinking or had any a-ha moments in the process. Consider creating a chart on their task that includes space for their individual work, notes from the discussion, and reflection after the discussion. Not only will this provide more insight for you as the teacher, but the students’ metacognition will increase their self-awareness, which supports recall in the future. Have students share & give feedback. The standard share out often includes time for students to work independently, followed by the teacher reviewing the correct answers. This practice can be modified to having students post their answers in small groups at the same time, and then visiting other groups' responses and leaving feedback or asking questions. By turning this process over to students, teachers can increase the responsibility and accountability for students to work with their groups and think critically if different groups have different responses. Leverage differentiation strategies. Building in differentiation as a result of a check for understanding is an effective way of structuring the lesson. Teachers can plan to use hinge point questions, where students receive a specific task as a result of their answer on a check for understanding question, or Four Corners, where students move around the room in real time to show their thinking and discuss with their peers. Both of these strategies leverage real-time responses and interaction to notice misconceptions and work to address them in the moment.
Checks for understanding are a very valuable touchpoint. Getting in the moment information about what is and isn’t clear for students provides insight into differentiation, student grouping, and tweaks to the next day’s lesson. When we reveal the “right” answer before we can gather information on what students know and can do, we might go for weeks before we realize that students have not been learning what they need to be successful on high-stakes assessments like unit tests, projects, or major exams.
It’s true: it is important to correct misconceptions, and we don’t want students to sit in frustration if we’re withholding information that can help them learn. And also, when we jump to reviewing the right answers before we’ve had a moment to collect the data or reflect on how students are processing the information in the lesson, we miss valuable insights that help us plan and prepare the learning pathway for students’ success.
Assess and address students' misunderstandings and misconceptions.

Imagine that you are grading your students’ summative assessments at the end of a unit or grading period. You are feeling extremely confident because your students have seemed engaged the past few weeks. But, as you start grading the seventh or eighth assessment, you realize that there are several questions that assess the same skill or content knowledge that no student has answered correctly. You may start thinking, what’s going on?
In my teaching, I experienced this exact situation. I felt frustrated and disappointed with myself and with my instruction. I thought that my students mastered the material based on their classroom engagement, but their summative assessments revealed otherwise. It led me to ask, how can I better identify and support my students’ needs before the summative assessment? Formative assessments are an excellent, low-stakes way to assess and address students’ misunderstandings or unanswered questions. They can take many forms: short writing prompts, exit tickets, brief video responses, whiteboard questions and answers, conversations, checklists, etc. In any form, they serve as an opportunity to give both teachers and students feedback about progress towards mastery. With that feedback, instruction can be adjusted to better support students’ learning.
Receiving instantaneous feedback
Virtual tools are a great way to ask students focused comprehension questions and to receive almost instantaneous feedback — and many of them are free to use. Socrative is an online classroom app that provides immediate feedback to teachers and students. You can use it to create and assign short, selected-response quizzes or open-response exit-ticket questions. Teachers can see students’ responses as soon as they are entered, and can quickly generate whole-class data. Gimkit is a gamified-way to gauge students’ comprehension. Students answer selected-response questions at their own pace, earn imaginary coins, and shop for powerups and game features. Games can be set to last for a set amount of time, which makes it an easy addition to any lesson plan. Plus, students love the gaming interface! Google Forms, which is integrated within Google Suites, allows you to adjust the settings of a Google Form and turn on the “make this a quiz” function. This will allow you to make an answer key for selected-response questions and to add points and automatic feedback to students. You can see automatic summaries for all quiz responses, including frequently missed questions, graphs marked with correct answers, and average, median, and range of scores.
Gathering invaluable student data
If you're looking for an alternative to digital tools, exit slips are a great way to gather information about students’ current understandings and/or questions. On a piece of paper or a document, ask students to respond to 1-3 questions that ask them to recall or apply information at the end of a lesson. Student-led conferences, including conferences between student/parent, student/teacher, or among student/parent/teacher allow students to highlight significant areas of growth and to set goals for future learning. Ask a student to bring a sample of their recent work — it could be a summative assessment, a written piece, or a collection of classwork. Then, ask students to reflect on how these learning artifacts reflect their progress in certain skill areas. These conferences can be student, teacher, or parent initiated. Color-coded student reflection can be a great way for students to reflect on the progress of their own learning towards a goal. When a student goes to turn in their practice work, ask them to highlight their name on the paper using a color-coded system: red to signify “I completely understand and could teach someone else this skill,” blue to signify “I think I understand, but need some more practice,” and green to signify “I don’t think I understand yet and may need some more support.” Keep the highlighters next to your turn-in bin for student work. For younger students, this can also be a great practice to remind them to write their names on their papers.
Thoughtful assessment practices
Listen and respond: whenever you give students a formative assessment, make sure to respond to students’ strengths and opportunities for growth. If a formative assessment only gets graded and handed back without an adjustment in instruction, that is a lost opportunity to provide student-specific and class-wide support. Keep it brief: formative assessments don’t need to be long or multi-tasked. They are often most effective when they target one specific skill or piece of content, especially when there is room for misunderstandings. Experienced teachers often know when and where students may get tripped up and can plan formative assessments accordingly. Encourage students’ self-reflection: use formative assessments as a metacognitive practice to get students thinking about their own thinking and learning. It can be great for a teacher to identify and offer support for a student’s misunderstandings, but it can be even better for a student to take that initiative for themselves.
Formative assessments are powerful tools for both teachers and students to reflect on the process of learning. Remember, they can take many forms and can still provide valuable insight into students’ progress towards mastery. Ultimately, formative assessments can help to shine a light on misunderstandings and misconceptions so that, as educators, we can offer necessary help and support to our students.
A flexible path toward mastery that provides structured support for students at all levels.

When I was growing up, my high school Social Studies teacher had a poster hanging on the wall that read, “If you think you can, or you think you can’t, you’re right.” The message was clear, even to teenagers -- the power to succeed or to reach a new goal is often inside of each of us. As educators, we know that our students’ mindsets play a major role in how hard they try, how much confidence they develop, and how committed they are to reaching their goals. But confidence alone doesn’t get them to a point of mastery. And desire alone won’t develop their skills, or increase their knowledge base, or level up their accuracy or precision. For those changes, our students need structured support!
This structured support often comes in the form of scaffolding. Like the large platforms that help construction workers reach the tall exterior of a building, scaffolding student learning creates platforms of support as teachers incorporate challenging texts, complex tasks, and abstract ideas into their instruction. Scaffolding is critical when holding high expectations and implementing a rigorous curriculum — but scaffolding alone doesn’t develop independent learners. Sometimes, scaffolding can become a crutch that teachers and students use, turning a support into a shackle. As educators, we often spend a lot of our planning time thinking about how to build scaffolds to break learning down into manageable components, but we can’t stop there. We must also consider the ways we gradually release scaffolding so that students can internalize and transfer their knowledge and skills to new tasks and topics.
A path toward mastery
Our Progressive Scaffolding Framework outlines a path for educators to consider when setting high expectations for students, helping them find that balance between necessary supports and structured enabling. Building on the ideas of Zone of Proximal Development and apprenticeship theories, the framework outlines a path toward mastery in four stages:
Stage 1: I do, you watch
When introducing new content or skills, we begin with the I do, you watch stage. We initiate this by introducing new concepts alongside prior knowledge, real world examples, or previous units of study. Our goal is to map new information onto our students’ activated schemas so that the new content or skills are contextualized and relevant. At this stage of instruction, we can prepare and provide a model of the task, using a Think Aloud mini-lesson where we walk our students through an internal thinking process that illustrates how we navigate the task and make decisions. Alternatively, we can outline the explicit steps to complete the task, or provide a roundup of the important information students need to know before diving in. The I do, you watch process can be presented to students working individually or in small groups. It’s important to remember that even at this stage, students shouldn’t be sitting silently. We always want students actively engaged, so we might add a note taking component, a reflection task, a meta-cognitive class discussion, or an element of inquiry so that students remain intellectually engaged in the process.
Stage 2: I do, you help
After laying the groundwork for the task in stage 1, we can move into stage 2, where students begin working with the content and task materials with support. Working in small groups, students might replicate the model with new information, restate or reword the essential steps in their own words, or engage in a small group discussion or group practice as a way to begin experimenting with and internalizing the skills.
Stage 3: You do, I help
In stage 3, the content and skills should be familiar to students after their initial explorations, and they should be ready to continue in pairs or small groups with more independence. Students are still in the development phase of their learning, so they may need additional support and will benefit from frequent check-ins, and suggested strategies — but here’s where we want to avoid returning to stage 1 supports. We’re looking for students to be engaged in a productive struggle. Students may benefit from suggestions of “fix up” strategies or options for what to do if they get stuck. At this stage, we want to push students beyond replicating the model or the example by having them practice the skill or apply content with a new format, a new context, or by making connections to other topics within the discipline or beyond. This is also a great stage to ask students to use one another as resources. While working in pairs and small groups is an excellent way to support students at their level and create opportunities for growth through collaboration, we want to ensure a high level of individual accountability so that some students don’t take on the burden for the group while others opt out of the learning process.
Stage 4: You do, I watch
In stage 4, students have been exposed to new content and skills, they’ve practiced working on a task informally with support, and they’ve begun making connections with other content information or demonstrating their learning through class activities and tasks. At this stage, it’s important to begin removing any unnecessary scaffolds to see what students can do independently. In the You do, I watch phase, we recommend providing a short review of the process and previous work done up to this point in the learning experience. After the review, we can be clear with students that they’re ready to try it out on their own. Provide a clear task and an adequate amount of time to complete the task (3-4 times as long as it would take you to do it). Students who are able to take on this challenge and demonstrate their skills individually prove that they’re meeting the expectations of the task and are ready to move forward to the next knowledge block or skill sets. Students who struggle at this stage help us to understand where and why they’re struggling, so that we can return to Stage 3 to provide targeted support.
How long does this take?
Like an accordion, this process can be expanded or compressed to meet the needs of your grade level and subject area. We might be able to move through the four stages within a single lesson, or it may be an expanded process that is organized across a week’s worth of lesson plans. Consider these two examples:
45-minute Lesson Plan Structure
5 minutes | Opening warm up: Inquiry question 10 minutes | I do, you watch: Mini-lesson modeling 10 minutes | I do, you help: Stop and jot, turn and talk reflection on the model 15 minutes | You do, I help: Small group practice 5 minutes | You do, I watch: Closing summary formative assessment
Week-long Lesson Structure
Monday | I do, you watch: Introduction, modeling, and reflection Tuesday | I do, you help: Small group discussion and practice Wednesday | You do, I help: Small group practice and connections, part 1 Thursday | You do, I help: Small group practice and connections, part 2 Friday | You do, I watch: Independent practice and formative assessment
The process of instruction and assessment is complex, especially when we’re trying to use data to inform instruction and support students who’ve struggled in the past. We want to be mindful to keep forward momentum toward rigorous learning goals while developing a clear path forward for students who begin at every level.
Principal Candace Hugee weighs in on the power of quantitative and qualitative data.

In my experiences as a classroom teacher, district level administrator, and as a professional development coach, I constantly struggle with the negative connotation often assigned to data. This is especially true in cases where educators see the term "data-driven instruction" as being synonymous with high-stakes testing. As my colleague G. Faith Little notes in Understanding Data: How Does It All Add Up?, data is not just a tool for evaluation — it’s a source of information.
The meaning of data
There are several major components of data-driven instruction. Understanding not only what they are, but what they mean is important when considering data points and the intended outcome of improving instruction.
A principal's perspective
with Candace Hugee In Data-Driven Instruction, authors Ben Fenton and Mark Murphy note that “in this era of increased accountability, nearly every principal has begun using data to help drive instructional practices. Principals in the most rapidly improving schools almost always cite data-driven instruction as one of the most important practices contributing to their success. But what exactly does data-driven instruction mean to them, and how do they achieve it?” I decided to take that question and others to Candage Hugee, Principal at the Urban Assembly School for Collaborative Healthcare. We have been working together for nearly three years, and I have found her experiences and application of data for her school to be most instructive.
Current studies indicate that educators in schools with data-focused programs think using data improves their instruction significantly. Very often, these schools have a tendency to gather various forms of data, because they recognize that all forms of data are valuable information. The more information we have, the more informed our decisions can be, and the better our instruction will be for our students.
Observe, infer, and take action on a problem of practice using three simple prompts.

What are we noticing? So, what does it mean for teaching and learning? Now what should happen next? These are some of the questions posed by one of our favorite resources — What, So What, Now What — which leans on our core values of critical reflection and cycles of inquiry.
Developed by Gene Thompson-Grove in 2004 and revised 2012, this protocol allows you to do several things at once: gather information, analyze and interpret a problem of practice, and envision next steps for your work. This is a versatile protocol that can be modified to support teachers, leaders, and even students as they work to understand curricular content.
Jumpstart your reflection
What, So What, Now What can help you to evaluate a recent experience, untangle a problem of practice, or inspect quantitative or qualitative data. After observing and analyzing what you already know, you can then work toward identifying the next steps for your practice.
This resource works in three phases: Understanding the event (What?)
Making sense of the facts and implications (So what?)
Identifying a course of action or new solutions (Now what?)
Engage students in inquiry
From here, the class can begin to share highlights from their charts, and begin to draw conclusions about the lesson.
What, So What, Now What is a highly adaptable tool that can promote curiosity, reflection, and accountability. Its flexibility allows for application with all members within a school community, and we encourage you to adapt it to best meet your needs.
How are you using this resource? Let us know in the comments!
Understanding the connection between what is taught and what is learned is a vital part of your classroom practice.

One effective tool we use when delving into new content is the resource It says...I say...So... With this tool as our guide, we can explore Danielson’s Framework for Teaching, 3d Using Assessment in Instruction.
Danielson 3d says...
“Assessment of student learning plays an important new role in teaching: no longer signaling the end of instruction, it is now recognized to be an integral part of instruction. While assessment of learning has always been and will continue to be an important aspect of teaching (it’s important for teachers to know whether students have learned what teachers intend), assessment for learning has increasingly come to play an important role in classroom practice. And in order to assess student learning for the purposes of instruction, teachers must have a “finger on the pulse” of a lesson, monitoring student understanding and, where feedback is appropriate, offering it to students.”
This means...
This looks like...
This is challenging, because...
So...
Let’s consider formative assessments. They are most helpful to us when making instructional decisions. They are used to monitor student learning and inform feedback. They help give us an overall picture of a child’s achievement. Formative assessments are used throughout the lesson. 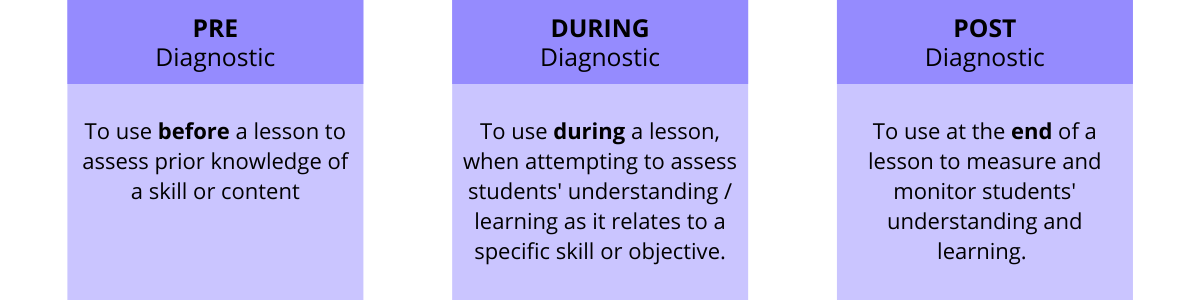
You can try...
Below are a few examples of practical pre-instruction assessments you can try in your classroom. 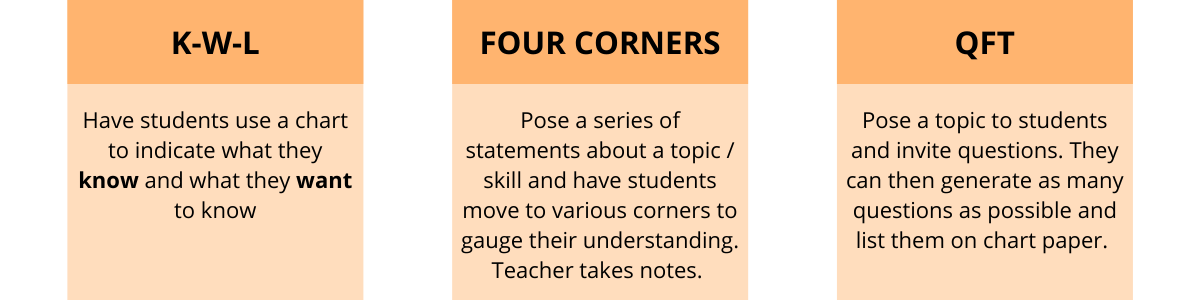
What are you trying in your classroom? What do you want to integrate into your practice? Tell us more in the comments! Learn more about opportunities to Design Coherent Instruction for your students.
Data-informed decision-making that creates groups of students who work collaboratively for a specific purpose.

From the one room schoolhouse to the giant lecture hall, the image we often conjure of teaching is of the sage on the stage, the professor imparting wisdom on the entire student body who are hanging on our every word. But the reality is that whole class instruction is rarely effective as a meaningful and sustainable learning experience. Students’ academic knowledge and skills grow more when they’re personally engaged in a task or challenge that meets their learning needs, supports their learning differences, and is customized to help them get to their next step.
Educators can often become overwhelmed with the prospect of differentiating instruction for every single student in the classroom, and often feel frustrated having to design 30 different lesson plans. The good news is that while students do need instruction to be personalized to meet their needs, many of their needs are similar. As educators, we want to better recognize our students’ academic, social, emotional, and skill-based needs and strategically match them with other students in the class.
Strategic grouping
There’s a big difference between working in a group, and working with a group. In an effort to increase group work and collaboration, we will sometimes push desks together so students are sitting in a group, and then give them permission to talk to their groups while completing an individual task. While this is community-oriented, we can differentiate it from working with a group on a shared task.
Strategic grouping is a key feature in teaching effective collaboration skills, and in streamlining instruction to meet the needs of our diverse learners. Strategic — or purposeful — groups demonstrate that we’ve put some time, energy, and thought into who students should work with. We can consider factors like literacy or numeracy performance, communication styles (introvert/extrovert), skills and talents (artists, writers, organizers), and even gender considerations for creating groups that are similar or mixed. One of the reasons strategic grouping is so difficult is because it requires us to know our learning outcomes, and to develop a strategy about the best ways to achieve this outcome. If I’m working on a unit where students will need to write an essay from a text they’ve read, I have to determine:
We can only answer these questions in the context of the class, the unit, and the end goal of the assessment.
Flexible grouping: number, color, shape
One of the most effective ways to establish strategic groups is to create groups that are flexible.
Developing strategic groups requires time and effort! And once groups are established and the students begin their work, it doesn’t mean that it will feel immediately successful. Just like any teamwork approach, groups take time to develop relationships, build trust, and establish healthy and productive routines. When groups change rapidly, even groups that are strategic, it makes it difficult to see the return on our investment. That’s why establishing strategic (purposeful to the context and task) and flexible groups can be a major win. One easy approach to flexible grouping is to design Number, Color, Shape groups. With a little bit of planning, we can set up three types of group structures at once. To establish flexible groups, consider three types of groups that need to be made:

Numbered pairs
Having students work in leveled pairs is an effective way to differentiate. By working with a partner, students can tackle more complex tasks, collaborate with a peer, or edit and revise their thinking as they complete an assignment. Students will also be able to develop more personal connections, which keeps them engaged and interested.
To set up numbered pairs, look at a class list and divide the total number of students in half. 30 students = 15 pairs. Then, begin matching students based on data — performance, reading levels, and personality can all be helpful data points to make matches. Once every student is in a pair, introduce the learning pairs by passing out numbered cards and invite students to find their match. It may be helpful to place numbers around the room so students know where to find their match, or create a class challenge to find partners without speaking. Once established, keep these numbered pairs for an extended period of time. Consider 4 - 6 weeks for pairs, given that it will take a few work periods before students feel comfortable, and once the pairs are working, making changes to the partnerships can derail the momentum. If some pairs don’t work out as planned, make specific changes in those situations. 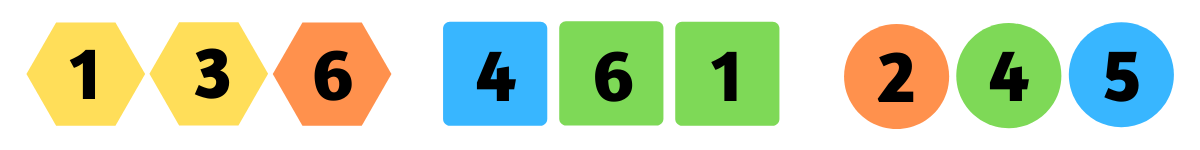
Same shapes
After students spend time working in pairs, their collaboration and communication skills will improve over time with their partners. We can take our differentiation to the next level by joining the numbered pairs into small groups of 4-5 students with similar ability levels.
Maybe you’ll combine groups 3 & 8 to create a square group, and groups 2 & 9 to become a circle group. Same shape groups will create leveled groupings that allow us to differentiate topics, products, processes, and text levels by assigning a specific task to each group based on their Zone of Proximal Development. If we know that groups 3 & 8 are composed of students who are reading 2-3 grade levels below expectations, we can assign the square group a text that’s at their instructional reading level and have them complete the same critical thinking task that the other groups are assigned. If we know that groups 2 & 9 are composed of students who are reading at or above grade level, we can assign them a more challenging text on the same topic, and have them complete the same critical thinking task that the other groups are working on. Same shape groups work well because after their discussion and group work, the class can come together to discuss the larger topic, without limiting the contributions of students with below-grade level reading skills. 
Color blends
Many — but not all! — learning goals are best accomplished by having students work in groups with peers on similar levels. When students only ever see examples of tasks and work products that reflect the same thing they would produce, they don’t have an opportunity to visualize how they can expand their thinking, reading, writing, or reasoning skills. By working with students in mixed ability (heterogeneous) groups, students of all different levels can participate in a jigsaw discussion or group projects. Mixed groups allow students to learn from one another, and play an individual role towards a shared goal.
We can create Color Groups using our Numbered Pairs and Same Shape groups as a starting point! Color Groups will be strategic, data-informed heterogeneous groups that can meet together consistently through a unit or term. To create the Color Groups, review the students in each Shape Group and begin distributing them evenly into Color Groups. Example: We can take one student from the square group, one from the circle group, one from the diamonds, and one from the hearts, and place them into the Purple Group. Because we’re mixing and matching from the Same Shape groups, we’re guaranteed a mix of performance abilities in the Color Blend Groups.
Bringing it all together
Strategic grouping requires data-informed decision-making to create flexible groups of students who work collaboratively for a specific purpose.
By designing these three sets of groups at one time, you can maximize your planning and minimize chaos! No more numbering off from 1 - 4 around the room. No more wandering around to find a partner. No more kids sitting in the back because they don’t have a group. If each student received a card on color cardstock, with a printed number, cut out in a specific shape, they could receive multiple group assignments within seconds. And after each grouping has been established, they’ll begin to learn how to work together for a purpose in each grouping they experience.
Baseline assessments are powerful — when you ask the right questions.

James Popham, our favorite assessment guru, explains that “the right data will, in fact, help teachers do a better job with students. Those are the data we need.” It makes sense that if we are using data to inform our instruction, that data needs to reveal authentic learning.
When I teach a Methods or Content Area Literacy course, I want to know what my students know about unit planning or principles of backward design before we dive in. My students are typically education majors and have been taking courses for two years, so it is likely that they are already familiar with the principles of Understanding by Design (UbD). On the first day of classes, I poll my students using a survey that asks how much they know about unit planning and Understanding by Design. In theory, this helps determine how much class time I need to reserve for unit planning, and how many lessons I need to design to help my students unpack the UbD principles and templates. I am also modeling what good teachers do: assessing what my students already know by using a baseline assessment that will inform my instruction. The surveys typically reveal that my students feel confident with unit planning and are familiar with Understanding by Design. Good! I continue with my curriculum. Inevitably, the first major assignment of the course is a unit plan, and the students who were confident in their day one surveys are suddenly flooding my email with questions: What exactly are ‘essential questions’? What do we mean by ‘skills’? How much do we need to ‘differentiate’? And how do you really ‘differentiate’ in a unit? And suddenly, I need to pause, recalibrate, and create lessons around principles that my students previously indicated they already knew. This means pivoting and redesigning lessons to make room for more unit planning content. During this process, there is a part of me that wonders: um, why wasn’t this clear when they filled out the baseline assessment on this topic? I could have planned for this. The same is true when teaching high school students. When teaching high school seniors, I tried to be a proactive and responsive teacher by polling my students at the beginning of the year, to find out what they knew about essay writing — and wouldn’t you know, they checked “yes” to knowing all aspects of the essay. Yes to knowing how to write a thesis statement. Yes to citing and explaining evidence. Yes to having experience writing introductions and conclusions. Great! I thought, until it was time for our first essay and suddenly I was inundated with requests and concerns around our essay assignment. I had to rethink and redo my plans, and squeeze in additional lessons around essay writing. Once again, my baseline poll gave me a false sense of what students know. They may have known what these writing concepts are in theory, but still needed support in their execution. Had I not polled my students at all, I would have assumed they needed more support in writing, and would have researched and created more thoughtful writing lessons. Instead, I relied on my baseline assessment and thus my essay writing lessons felt rushed, as we were closing out the semester and trying to meet deadlines. Using data from baseline assessments can be helpful in informing instruction, but in my case, I was not asking the right questions.
Answers vs. action
The next time I teach an education course, I will instead ask students to actually write out a unit plan as a baseline assessment, instead of asking them about their knowledge and comfort with the concept of unit planning. Similarly, the next time I work with high school students, I will ask them to write an in-class essay to use as a baseline assessment, and use those essays to inform my planning. These student samples will serve as formative assessments, and will give me insight into what my students understand and don’t. From there, I can design lessons tailored to my students’ needs. Using a baseline assessment can offer very straightforward results, in some courses. Students either know how to graph functions or they don’t; they’ve learned about causes of the Revolutionary War or they haven’t. But when we are using baseline assessments to determine the extent to which students know a topic that they have familiarity with, it would be more helpful to have them produce or write out the assignment, rather than self-assess their knowledge on the topic. This is why I will shift my formative assessment from reflecting on prior knowledge to requesting that students take action to demonstrate their knowledge.
As teachers, we have to be flexible and allow for some spontaneity in our instruction. When we realize that a baseline assessment isn’t accurately revealing what our students understand, we need to be prepared to pivot and shift our instruction to meet them where they are. Baseline assessments can be helpful, but what is more crucial is committing to meeting our students where they are, and uncovering the authentic knowledge that lives within them.

Observing student behavior and communication to inform our instruction and create meaningful learning opportunities.

Productive struggle, a term that has gained popularity over the last decade, is found in instruction that “stretches students’ thinking and performance just beyond the level they can do on their own — the zone of proximal development.”
Finding and teaching to each of our students’ sweet spots is no easy feat. As teachers, we are often guilty of over-scaffolding, or rescuing our students out of fear or our desire to avoid student discomfort. Alternatively, we sometimes push students too far by introducing a task that is well beyond their level, without also providing the necessary tools or assistance they need to meet the challenge. In order to support students in productive struggle, we need to be patient, persistent, and committed in gathering and using data in our instruction. This can include quantitative data such as reading levels and test scores, or perhaps more importantly, student actions and behaviors — what we know as qualitative data. How can we gather qualitative data about our students in order to support them in finding a meaningful, productive level of struggle in their learning?
Identifying zones of struggle
Before we can locate promising practices for our instruction, we first need to identify look fors and listen fors that can help us determine if and when students are being pushed too far, or are not being pushed enough. When students are not being challenged enough or instruction is below their level, we consider this a level of no struggle. At the other end of the spectrum is destructive struggle, in which tasks are too challenging for particular students, or are significantly above their level. A zone of productive struggle lies between the two. 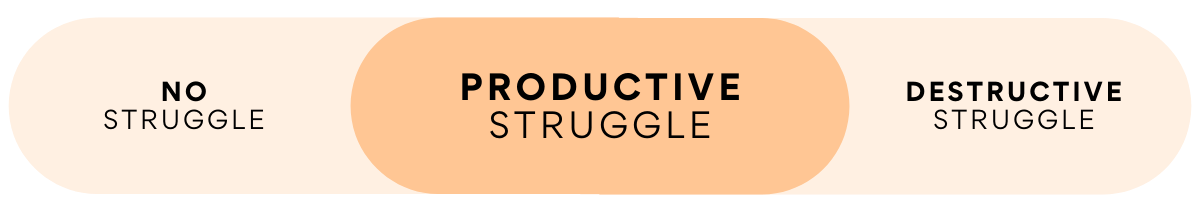
Let’s identify the look fors and listen fors for each of these zones:
When students are in a no struggle zone, it might look like and sound like:
When it comes to the destructive struggle zone, we might observe students who:
In contrast, when students are in a zone of productive struggle, we are likely to see them:
Observing student behavior online
Given that so much instruction is happening remotely, and we may not be able to observe the same behaviors from our students in a remote setting, we can also identify look fors and listen fors when online teaching and learning is taking place. In a no struggle zone, we might observe online students who are:
When students are in a place of destructive struggle online, they might:
In contrast, productive struggle might look and sound like:
Determining students’ current zones of struggle is a helpful starting point for potential shifts in your instruction. Different students at different times might exhibit these behaviors, and this can inform your responses and course of action. By leaning on these look fors and listen fors, we can more effectively and confidently determine if, when, and how many scaffolds need to be introduced so that students are advancing their skills.
Preemptive planning
In addition to locating student behaviors and communication that can surface as they’re working on tasks, we can also lean on preemptive planning, which will support us in predicting and creating opportunities for productive struggle in our classrooms. Preemptive planning encourages thoughtful consideration and analysis of each task we’re offering students — whether it’s a culminating task of a unit or a task for a particular lesson. This process involves asking questions such as:
These questions can inform your instructional design as you work to meet the individual needs of students. Your assessment of students’ areas of struggle can inform where and how you’ll need to scaffold your instruction, and the areas of strength can inform where and how you introduce extensions or opportunities for deeper learning. Similar to identifying and responding to look fors and listen fors, preemptive planning is a meaningful form of data collection that can help you predict or anticipate student performance and ultimately use these predictions to inspire, inform, and cater your planning and instruction to your students.
There is no denying the challenges involved in meeting students where they are, especially when teaching large numbers of students — many of whom are on vastly different levels — or teaching at a distance. But by engaging in strategic planning based on data and evidence, we can create opportunities for our students to challenge themselves, recognize that they can do hard things, and make progress in their learning.
Three strategies for taking the pulse of your class, when teaching online.

Although I have been teaching via Zoom for several months, I don’t know if I will ever truly adjust to speaking to my computer and seeing the faces of my muted students in little boxes. But Zoom etiquette, as we have all come to learn, is to mute when someone else is speaking so everyone can hear the speaker. Herein lies my main discomfort as a Zoom teacher: to speak to my students and to not hear their little sighs, mmhmms, and quiet huhs?, has been my biggest unexpected challenge. It’s hard to get a sense of what my students are thinking or reacting to without hearing these small sounds. And while I know I can’t rely on these impulsive responses as a form of assessment, they’ve always helped me take a quick pulse of my class to check for understanding.
I’m not suggesting that we use the impromptu reactions of our students as a way to assess them — but as teachers, hearing students’ reactions nudges us to wonder, Is this a good place to stop? Do I need to check in with a few students? I miss that. So with our students on mute (unless they are speaking), formative assessments are as essential as ever in online teaching. James Popham, the assessment guru, explains that “formative assessments help students learn” because they are “assessments for learning;” not “assessments of learning.” In other words, formative assessments gauge how much our students are understanding or processing information; the purpose is not an assessment for teachers to grade for accuracy, but for teachers to use to adjust their lesson planning. After all, formative assessments are often linked to effective teaching practice. The Black and Wiliam Research Review, from over 20 years ago, “shows conclusively that formative assessment does improve learning.” (Black and Wiliam, 1998a, p. 61).
Recipes for success
I have used a variety of formative assessments in online teaching, and they each serve a different purpose. Here are the formative assessments I am currently using while teaching online: Consistent breakout groups As Courtney Brown mentions in Discussions During Distance Learning, it is best to keep students in the same small groups throughout the semester, instead of randomly grouping them. When students are online, they have no chance to get to know each other — there is no partner share, no turn and talks, no walking into class together and making conversation. To implement this with my students, I put them in small groups using the breakout rooms feature on Zoom, and then used the polling feature to ask students whether or not they were okay staying in these same groups throughout the semester. This would allow them an opportunity to form deeper connections within their group, and feel more comfortable interacting with one another. Thankfully, they all answered “yes.” Once students are in the same groups, they are able to visit our class Google Drive folder where they can find folders for each week we meet. For each class, I create a simple note taking template that changes depending on our topic of the day, and students use these templates to capture their small group discussion ideas. When students return to the main group, they share these documents with all of us by sharing their screen in Zoom. While students are in their groups, I can assess how they are doing in two ways — first, by popping into each breakout room, to hear moments of their conversations and to see if they have questions; and second, by viewing their Google documents to see how they are progressing. This is my favorite way to check in on my students’ learning in real time — viewing their writing as it happens helps me determine who may need some more scaffolding or assistance, as well as which group is already finished with the note-taking document and may be ready to move on. It is also my way of noting which students are writing in these documents, thanks to Google’s editing feature. Flipgrid To vary how students discuss their learning, I turn to Flipgrid as a way to hear students’ takeaways from class. First, I create my own video to model what they might say in theirs, using a text or discussion topic we have already discussed previously. This way I don’t steal any of their good ideas! By demonstrating how I would like them to respond to a text (by discussing quotes, or connecting the text to a real-world connection), I help them craft their Flipgrid video. To ensure my students watch others’ videos, I ask them to reply to at least two other classmates’ videos on our class discussion board. Using Flipgrid as a formative assessment is a way to assess student learning, using an alternative genre. Padlet I often use Padlet as a type of “exit slip,” or as a way for students to give me feedback. When asking students for the latter, I make sure to update our Padlet’s settings so that participants can submit their responses anonymously. Both types of Padlets will include a direct prompt, such as: What did you learn today about ____? What questions do you still have? Students can see each others’ responses, and they, too, can get a pulse on how our class is doing and what their classmates are thinking. When I ask for feedback, I might prompt them by asking, How is our class going? Or What suggestions do you have? This is a great way for me to receive feedback directly, and because it is anonymous (a must for this kind of teacher feedback!), I trust that students can be more honest. Using a Padlet board as a formative assessment is a way for me to check for their understanding, confusion, and gather overall suggestions for our class.
Teaching online has pushed me to become even more intentional about how I informally assess my students, and how I use those assessments to adapt my instruction. I will continue to find more ways to include formative assessment in my classroom, not only because these types of assessments lead to more effective instruction, but because I know it makes me more responsive to my students’ needs — especially when I can’t rely on hearing their in-the-moment responses during class. When we return to normalcy, I can’t wait to hear their thinking sounds again.
Ways to get clear feedback that can inform further instruction.

We check for understanding constantly, don’t we?
“Does that make sense?” "Know what I mean?” “Get it?” When it comes to our classrooms, we’re looking for more precise ways to check for understanding. Here are some simple ways and a few tools to use in your class as soon as tomorrow!
Thumbs up!
A simple and positive hand gesture can check to see who is hearing your instruction and who needs more support to move forward. You can use this:
Choose your emoji
Expressions are a helpful way for students to share how they’re feeling or thinking about new or challenging content. It is especially useful for English Language Learners and Students with Disabilities. Using emojis (which can be individual cut outs or together on one piece of paper), ask students to choose the emoji that best represents their current experience. As you move around the room, you can customize your questions and support. Find out more about what the happy faces understand, what the thinking faces are working out, and what the sad faces need to make their struggle productive. 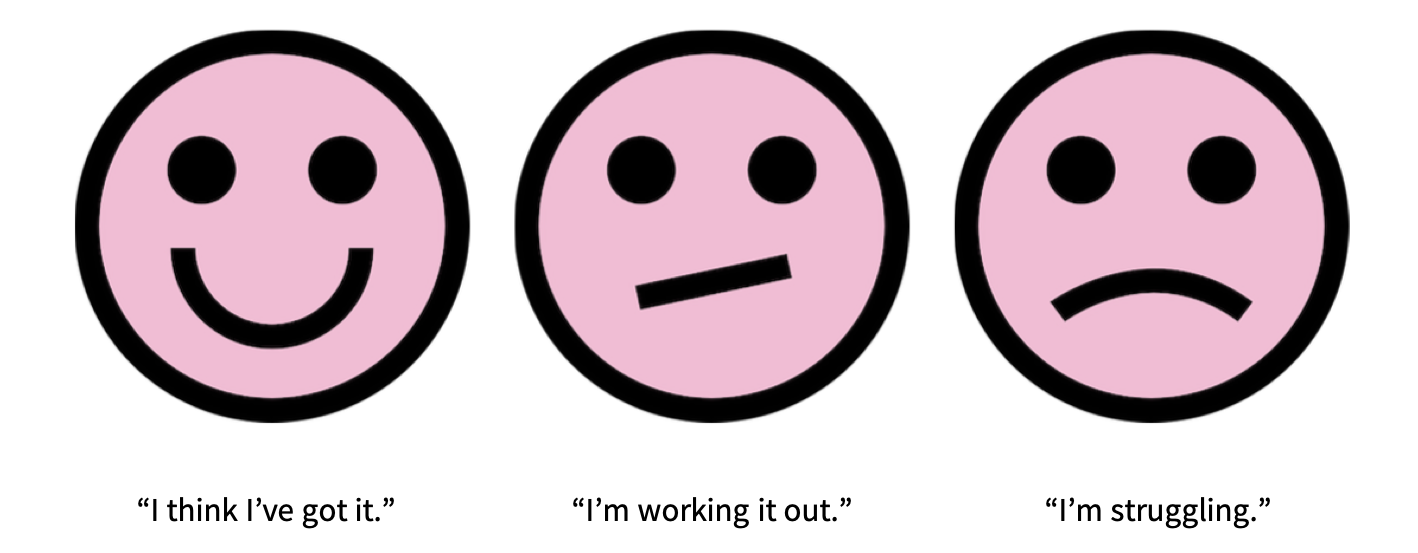
Entrance tickets
See how the homework informed thinking or where yesterday’s mini-lesson landed by collecting a little data at the beginning of class. You can even combine this tool with the emojis you've used previously:
Whatever the tool, getting clear feedback is key to differentiating your instruction and increasing communication with your students!
Opportunities for micro assessments that ensure students are developing the skills needed to overcome academic obstacles.

We often think about learning like a marathon, as if it's this long, long race where everyone begins at the same starting line, sets their pace, and runs at that pace for a long time until they arrive at the finish line. But there’s a problem with this analogy. The problem is that learning does not typically happen in consistent, incremental stages. Instead, learning happens in fits and starts, and in the best situations, it is the result of being deeply curious about a subject, topic, or theme and engaging in a productive intellectual challenge. In fact, when we really get down to it, learning isn’t like running a marathon at all! If learning is like running, then it’s probably a lot more like jumping hurdles.
When jumping hurdles, runners begin at the starting line and then sprint as fast as they can towards the first obstacle they have to overcome. If they’re successful, they continue to sprint forward. If they are not successful, the hurdle falls down, or worse — they fall down. Then they have to pick themselves back up and start again. Runners who can overcome all of the hurdles sprint through each stage on the track. Runners who cannot fall behind abruptly, and sometimes, permanently. To train runners in hurdles, coaches help them practice by providing a set of smaller obstacles along the track, and train them through practice sessions where they develop specific strategies that will refine their skills. Coaches watch the moves the runners make while they’re jumping, and study these moves to give the runners actionable feedback about ways they can adjust their footing, their stance, and their speed — all of which help them to become better at the sport. This is the same kind of training and support that checks for understanding provide for students.
Micro assessments
Checks for understanding are micro assessments that teachers can build into their lessons to ensure that students are developing the strength, skills, and strategies necessary to overcome the academic obstacles that will be presented in a long-term project, assessment, or high-stakes test. They are mini-hurdles that can help a teacher determine which students are sprinting ahead, which have minor gaps in understanding, and which are struggling to make sense of the lesson content or skills. Traditional instruction organizes the procedure of a lesson so that the teacher presents on the important topic of the day, the students engage in practice related to that topic, and then go home. Everyone holds their breath and hopes that the students do well on the quiz at the end of the week. In our analogy, this model would be equivalent to a coach turning away from a race, hoping their runner is able to finish. Students, like runners, need three things from their teachers to increase their speed, strength, flexibility, and stamina. 1. Tasks that gradually increase in difficulty Like a coach who lays out smaller hurdles on the track to teach runners about basic techniques, teachers can provide short tasks for students at strategic points in a lesson. One simple structure for a lesson would be to include one check at the beginning of the lesson, one in the middle, and one at the end of the class period. The opening check serves as a baseline understanding of what students remember from a previous lesson, and assesses their prior knowledge or current thinking about a topic. The mid-lesson check becomes a moment to micro-assess their understanding of the essential learning of the lesson. What must students understand in order to meet the learning target or objective? Finally, an end of lesson check gives us vital information about how students are leaving the class. This check informs our instruction for the next day’s lesson. 2. Actionable feedback for micro adjustments We often assume that assessments always equal grades. But just like not all runs are races, not all tasks need to come with the heavy weight of a graded assignment. Small and simple assessments designed as checks for understanding provide key insights into students’ knowledge while it’s in formation. This is critical to helping teachers understand how students are making meaning, as well as how they’re interpreting (or misinterpreting) the content. Rather than focusing on how many points to provide, consider ways of providing students with actionable feedback that includes micro adjustments. Micro adjustments may include offering students a suggested next step, pointing out something they did well, or giving a tip as to what would have made their response more complete. The goal is to move away from evaluative feedback like “good job” or “needs work” and move into actionable feedback, which gives students a concrete next step to practice. When we get good at building checks for understanding into our lessons, we can design our lesson sequence to build on the feedback we give students in the moment. 3. Celebration of progress As many runners can attest, marking personal progress is critical to building confidence even when someone else crosses the finish line first. As educators, it is essential that we are able to note specific areas of improvement for students at all levels. We can make connections between their gains and future successes, which increases their investment in their learning and can help them to set short- and long-term goals.
Getting started
There is no shortage of strategies for checks for understanding. Below is an example of one of our favorite sequences using US Government as an example topic.
There are countless ways to monitor our students’ learning. When we are engaging in beginning, middle, and end of lesson checks for understanding, we have so many opportunities to notice our students’ process and progress, to reflect with them, to encourage them, and to help them leap over the obstacles they encounter on their learning journey.
|
ARTICLES BY TOPICARTICLES BY AUTHOR


|


|
|
The Center for Professional Education of Teachers (CPET) at Teachers College, Columbia University is committed to making excellent and equitable education accessible worldwide. CPET unites theory and practice to promote transformational change. We design innovative projects, cultivate sustainable partnerships, and conduct research through direct and online services to youth and educators. Grounded in adult learning theories, our six core principles structure our customized approach and expand the capacities of educators around the world.
|
ABOUT US
525 West 120th Street, Box 182 New York, NY 10027 416 Zankel Ph: (212) 678-3161 [email protected] Our Team Career Opportunities |
RESOURCES
Professional Articles Ready-to-Use Resources Teaching Today Podcast Upcoming PD Opportunities |
COACHING SERVICES
Custom Coaching Global Learning Alliance Literacy Unbound New Teacher Network Student Press Initiative |